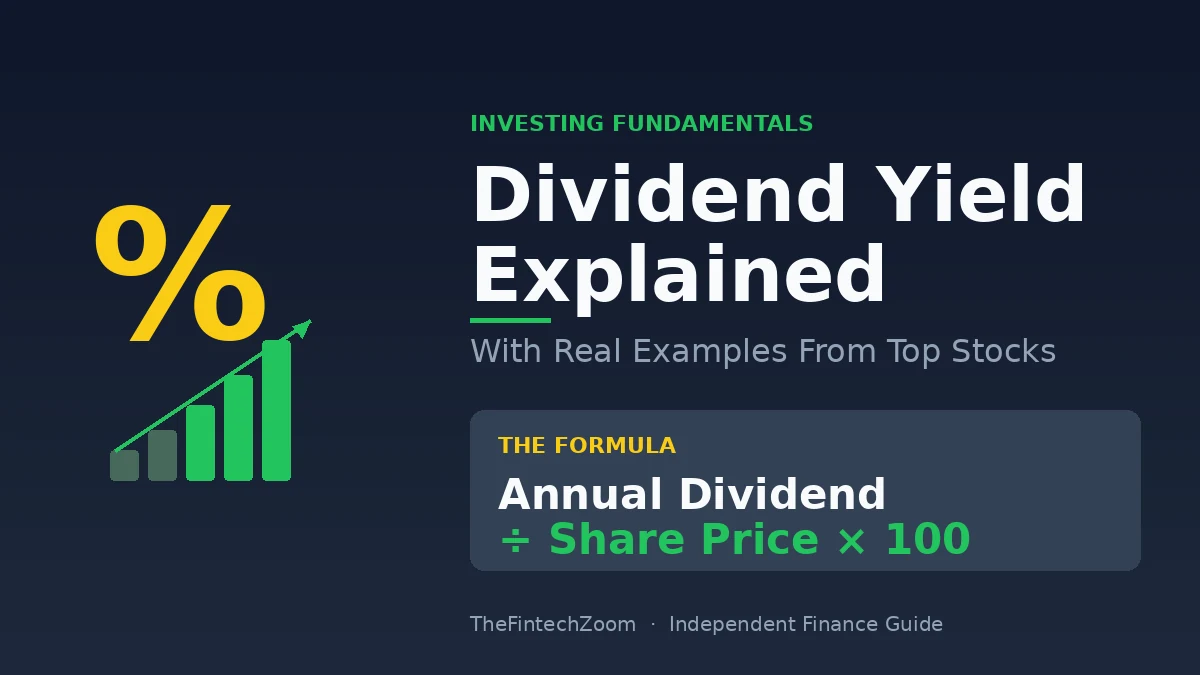
Dividend yield is the annual dividend a company pays divided by its current share price, shown as a percentage. If a stock trades at $100 and pays $4 a year in dividends, its yield is 4%. It tells you, in plain language, how much cash income each dollar invested produces in a year — separate from any gain or loss in the share price itself.
Most beginner guides stop there and leave you with a number that looks tidy but hides a lot. A 9% yield can be a gift or a trap. A 1% yield can be the smartest income stock in your portfolio. After years of reading earnings reports and rebuilding model portfolios for our readers at TheFintechZoom, I wrote this guide to give you what those generic posts skip — the formula, real examples from Coca-Cola, Apple, Realty Income, and AT&T, and the exact mistakes that cost dividend investors money.
What Is Dividend Yield in Simple Terms?
Dividend yield is the percentage of a stock’s price that the company returns to shareholders as dividends each year. It’s the income rate of a stock, the same way an interest rate is the income rate of a savings account. A 3% yield means you earn $3 a year for every $100 invested, before tax and before any share-price change.
Think of it like rent on a rental property. The house has a value (the share price), and the rent is the dividend. Rental yield tells you what return the rent gives you on the price you paid. Dividend yield works the same way — it just describes a slice of a business instead of a slice of real estate.
Two things drive the number, and both move:
- The dividend — set by the company’s board, usually paid quarterly in the U.S., monthly in some cases like REITs.
- The share price — set by the market every second of every trading day.
This is why dividend yield is not a fixed feature of a stock. When the price falls, the yield rises mechanically, even if the company hasn’t promised an extra cent. That single fact is the reason many “high yield” stocks turn out to be warnings rather than opportunities — something we’ll come back to.
How Do You Calculate Dividend Yield?
The dividend yield formula is: Dividend Yield = (Annual Dividend per Share ÷ Current Share Price) × 100. Multiply by 100 to get a percentage. The annual dividend is the total of the last four quarterly payments (called “trailing”), or four times the most recent payment if the company just raised it (called “forward”).
Here’s how to actually run the calculation in 60 seconds.
Step 1: Find the annual dividend per share
Open the company’s investor relations page or any free finance portal (Yahoo Finance, Google Finance, your brokerage). Look for “dividend” or “distributions.” You want the per-share amount paid over the last 12 months. If a stock paid $0.50 every quarter, the annual figure is $2.00.
Step 2: Find the current share price
This is the easy part — it’s the live quote on any finance app. Use the most recent close if you want a steady number for comparison.
Step 3: Divide and multiply by 100
Annual dividend ÷ price × 100 = yield.
Example: Annual dividend $2.00 ÷ share price $50 = 0.04 × 100 = 4.0% yield.
Step 4: Decide whether to use trailing or forward yield
Trailing yield uses the dividends actually paid in the last 12 months — it’s history. Forward yield uses the next four expected payments — it’s a forecast. If a company just raised its dividend, forward yield is more honest. If it just cut, trailing overstates what you’ll actually receive. I default to forward yield for any company that announces dividend changes regularly, and I cross-check both before publishing any income analysis on our site.
Real Dividend Yield Examples From Well-Known Stocks
Real examples make the formula click. Below are five widely held U.S. stocks across very different yield profiles — a low-yield growth name, a steady consumer brand, a high-yield telecom, a monthly-paying REIT, and a stock with a famous dividend cut. Each shows what dividend yield does and doesn’t tell you.
Example 1: Apple (AAPL) — the low-yield growth case
Apple started paying dividends again in 2012 after a 17-year pause. At roughly $1.00 per share in annual dividends and a share price around $230, the yield works out to about 0.4%. That looks tiny next to a savings account. But Apple has bought back hundreds of billions of dollars of its own stock over the same period, which delivers value to shareholders in a different form — fewer shares outstanding means each remaining share owns a bigger slice of the company. Lesson: a low yield isn’t a sign of a bad dividend stock. It can mean the company is returning cash to shareholders another way.
Example 2: Coca-Cola (KO) — the dividend aristocrat
Coca-Cola has raised its dividend every year for over 60 consecutive years, making it part of an elite group called “Dividend Kings.” Its annual dividend has been around $1.94 per share in 2024. At a share price near $65, that’s a yield of about 3.0%. Lesson: mid-range yields from companies with long records of raising the dividend are the workhorses of income portfolios. The yield looks ordinary; the consistency is not.
Example 3: Verizon (VZ) — the high-yield telecom
Verizon pays around $2.71 per share in annual dividends. At a share price near $42, the yield runs around 6.4%. That’s roughly double the S&P 500 average. The high yield reflects the market’s mixed view on the telecom industry — heavy debt, slow growth, intense competition with T-Mobile and AT&T. Lesson: high yields aren’t free. They usually compensate investors for risks the market sees in the underlying business.
Example 4: Realty Income (O) — the monthly-paying REIT
Realty Income trademarked the phrase “The Monthly Dividend Company” and pays out roughly $3.16 per share annually, spread across 12 monthly checks. At about $58 per share, the yield is near 5.4%. As a Real Estate Investment Trust, Realty Income is legally required to distribute at least 90% of taxable income to shareholders — which is why REIT yields tend to run higher than the broader market. Lesson: the legal structure of an investment shapes its yield. REITs aren’t paying more out of generosity; they’re paying more because the tax code requires it.
Example 5: AT&T (T) — the famous dividend cut
For decades, AT&T was the textbook high-yield stock — often paying yields above 7%. In 2022, after spinning off WarnerMedia, the company cut its dividend by nearly half. Anyone who bought AT&T purely for that lofty yield watched both the dividend and the share price fall at the same time. Lesson: an unusually high yield is the market’s way of telling you it doesn’t believe the dividend will hold. Listen.
Comparison table
| Stock | Annual Dividend | Approx. Price | Approx. Yield | Profile |
|---|---|---|---|---|
| Apple (AAPL) | $1.00 | $230 | 0.4% | Low-yield growth, big buybacks |
| Coca-Cola (KO) | $1.94 | $65 | 3.0% | Dividend King, 60+ year raiser |
| Verizon (VZ) | $2.71 | $42 | 6.4% | High-yield telecom |
| Realty Income (O) | $3.16 | $58 | 5.4% | Monthly REIT distributions |
| AT&T (T) | $1.11 | $22 | 5.0% | Post-cut yield |
Prices and yields fluctuate with the market — always recalculate using current quotes from your brokerage before making any investment decision.
What Is a Good Dividend Yield?
A “good” dividend yield generally falls between 2% and 6% for mature, profitable U.S. companies. The S&P 500’s long-term average yield has hovered around 1.8% to 2%, so anything meaningfully above that range deserves extra scrutiny. Yields under 1% usually signal growth-focused companies, and yields above 7% often signal stress.
But the number alone is meaningless without context. Here’s the framework I use when evaluating yield for our subscribers.
The “is this sustainable?” check
A 5% yield from a company earning $10 a share is very different from a 5% yield from a company earning $1 a share. The first can comfortably keep paying; the second is likely living beyond its means. Two quick metrics tell you which you’re looking at:
- Payout ratio — annual dividend divided by annual earnings. Under 60% is generally healthy for most industries. Over 100% means the company is paying out more than it earns, which can’t last.
- Free cash flow coverage — does the company generate enough actual cash (not just accounting profit) to cover the dividend? You’ll find this in cash flow statements.
The “compared to what?” check
A 4% yield looks great when 10-year Treasury bonds pay 1.5%. The same 4% looks ordinary when Treasuries pay 4.5%. Dividend yields don’t exist in a vacuum — they compete with bonds, money market funds, and high-yield savings accounts for your dollars. Always compare against the risk-free rate.
The “yield trap” warning sign
If a stock yields more than twice the sector average, ask why. Sometimes it’s a genuine bargain after a temporary scare. More often, the market knows something you don’t, and the dividend is about to be cut. As I tell readers at TheFintechZoom: a yield that looks too good usually is.
Dividend Yield vs Dividend Growth: Which Matters More?
Dividend yield tells you what you earn today. Dividend growth tells you what you’ll earn five and ten years from now. For most long-term investors, the growth rate matters more than the starting yield, because compounding turns a small growing dividend into a large one — while a high static yield often shrinks in real terms as inflation eats it.
Here’s a simple comparison that makes the point.
Imagine two stocks, both bought at $100:
- Stock A: 5% yield today, no growth. Pays $5 every year forever.
- Stock B: 2% yield today, grows the dividend 10% per year. Pays $2 in year 1, $2.20 in year 2, $2.42 in year 3…
By year 11, Stock B’s dividend overtakes Stock A’s. By year 20, Stock B is paying you over $13 per share annually — while Stock A is still paying $5. And because the market typically rewards growing dividends with a higher share price, your capital gain on Stock B will usually outpace Stock A’s as well.
This is the math behind “Dividend Growth Investing,” made famous by writers like Jason Fieber and the late Charles Carlson. It’s also why companies like Coca-Cola and Procter & Gamble — with their unspectacular 3% starting yields — have made early investors very wealthy.
The practical answer for most people: don’t pick one or the other. Build a portfolio with both. Pair some growth-yield names (lower current yield, faster growth) with some high-yield names (more current income, slower growth) so you get cash today and compounding tomorrow.
Common Mistakes Investors Make With Dividend Yield
The single most expensive mistake in dividend investing is chasing yield without checking whether the company can actually afford to keep paying it. Other common errors include ignoring taxes, confusing yield with total return, and forgetting that yield rises when the stock falls — which is rarely a buy signal on its own.
Here are the mistakes I see most often, in rough order of how badly they hurt portfolios.
Mistake 1: Chasing the highest yield on the screen
Stock screeners make it easy to sort by yield and start buying from the top. This is also the fastest way to end up holding the worst businesses in the market. A 12% yield often means the share price has been cut in half because something is seriously wrong. The yield is high because the price is low — and the price is low for a reason.
Mistake 2: Ignoring the payout ratio
If a company pays out 95% of its earnings as dividends, it has no room for error. One bad quarter and the dividend gets cut. Sustainable dividends usually come from payout ratios well below the danger zone — under 60% for most non-REIT companies.
Mistake 3: Forgetting about taxes
In the U.S., qualified dividends are taxed at long-term capital gains rates (0%, 15%, or 20% depending on income), while non-qualified dividends are taxed as ordinary income. REIT distributions are mostly non-qualified. A 5% REIT yield in a taxable account can net you less than a 4% qualified dividend after tax — yet most yield comparisons ignore this entirely.
Mistake 4: Confusing yield with total return
If you buy a stock at $100 yielding 4%, collect $4 in dividends, and the stock drops to $90 — your total return is negative 6%, not positive 4%. Yield is one component of return, not the whole picture.
Mistake 5: Buying after a price crash without doing the work
Yes, yield rises when price falls. No, that doesn’t automatically make the stock a bargain. Sometimes the market is right, the business is broken, and the dividend is days away from being cut. Look at the underlying numbers before you “buy the dip.”
Mistake 6: Not reinvesting
Most brokerages let you turn on automatic dividend reinvestment (a DRIP) with one click. Over 20+ years, reinvested dividends have historically made up roughly 40% of the S&P 500’s total return. Letting them sit as cash in your account leaves serious money on the table.
Frequently Asked Questions
Is a higher dividend yield always better?
No. A high yield often signals that the share price has fallen because investors expect a dividend cut. The healthiest dividend stocks usually have moderate yields (2%–5%) backed by strong earnings, low payout ratios, and a long record of raising payments. Yield is one input — sustainability is the test that matters more.
How often is dividend yield calculated?
Dividend yield changes every time the share price moves, which is constantly during trading hours. Finance sites update it in real time. The dividend itself only changes when the company’s board declares a new amount, usually once per quarter for U.S. stocks. So in practice, day-to-day yield changes come from price moves, not dividend changes.
What is a dividend yield trap?
A dividend yield trap is a stock whose yield looks unusually high because its price has collapsed, but whose dividend is about to be cut. Investors who buy chasing the headline yield often end up losing money on both the dividend reduction and a further share price drop. AT&T’s 2022 dividend cut is a well-known example of this pattern.
What’s the difference between dividend yield and dividend rate?
Dividend rate is the dollar amount paid per share annually — a flat number like “$2.00 per share.” Dividend yield is that rate expressed as a percentage of the current share price. The rate stays steady between board decisions; the yield moves with every tick of the stock price. Both describe the same dividend from different angles.
Do all stocks pay dividends?
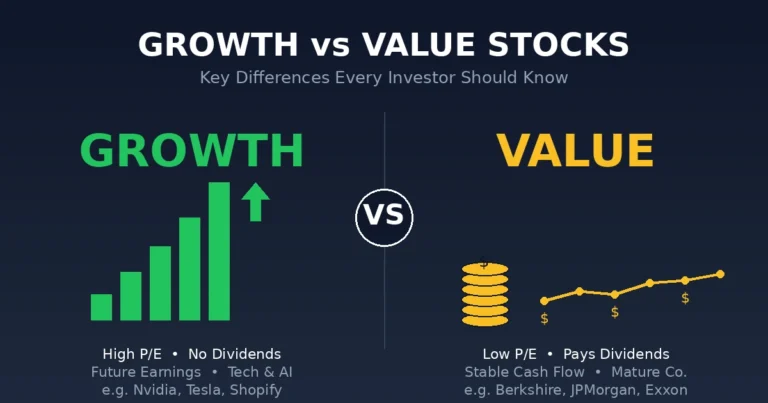
No. Many companies — especially younger growth firms like Amazon, Tesla, and Alphabet (which only began paying in 2024) — reinvest their profits into expanding the business instead of paying dividends. There’s nothing wrong with this; it’s a different strategy. Dividends are most common among mature companies in stable industries like consumer goods, utilities, and financials.
What is a good dividend yield for retirees?
For retirees focused on income, a portfolio yield of 3%–5% is generally a reasonable target — high enough to generate meaningful cash, low enough to avoid the riskiest yield-trap names. Many retirees blend dividend-paying ETFs (like SCHD or VYM) with individual blue-chip names to spread risk while still producing steady income.
How is dividend yield taxed in the U.S.?
Most dividends from U.S. companies held over 60 days are “qualified” and taxed at long-term capital gains rates: 0%, 15%, or 20% depending on your income. REIT distributions and some other dividends are “non-qualified” and taxed at your ordinary income rate, which is higher. Always check your 1099-DIV form to see which bucket your dividends fall into.
Can dividend yield be negative?
No. Dividend yield can be zero if a company doesn’t pay any dividend, but it can never be negative. A company can suspend or cut a dividend, but it can’t charge shareholders to hold the stock. If you ever see a negative yield reported, it’s a data error.
Conclusion: Use Yield as a Starting Point, Not a Verdict
Dividend yield is one of the most useful — and most misused — numbers in finance. Used correctly, it tells you the income rate of a stock and lets you compare it against bonds, savings accounts, and other stocks. Used carelessly, it leads investors straight into yield traps, dividend cuts, and underperforming portfolios.
The simple takeaway: the yield is the start of the conversation, not the end of it. Before buying any dividend stock, run through this checklist — what’s the yield, what’s the payout ratio, has the dividend grown over time, can the company comfortably afford the next payment, and how does the total return compare to alternatives. Most generic finance posts will give you the formula. The work above the formula is what separates investors who build wealth from dividends and investors who chase yield and end up disappointed.
Your next step: pick three dividend stocks from your watchlist and calculate the yield yourself using the formula in Step 3. Compare them, check the payout ratios, and see whether the numbers tell a different story than the headline yield. That single exercise will teach you more about income investing than another 10 articles will.
For more honest, jargon-free guides to investing fundamentals, browse the rest of our investing section at TheFintechZoom — we’re an independent education site, not a brokerage, and we don’t get paid to push any product.