Every time the stock market moves, you hear two names: the Dow and the S&P 500. News anchors report them side by side, as if they measure the same thing.
They don’t.
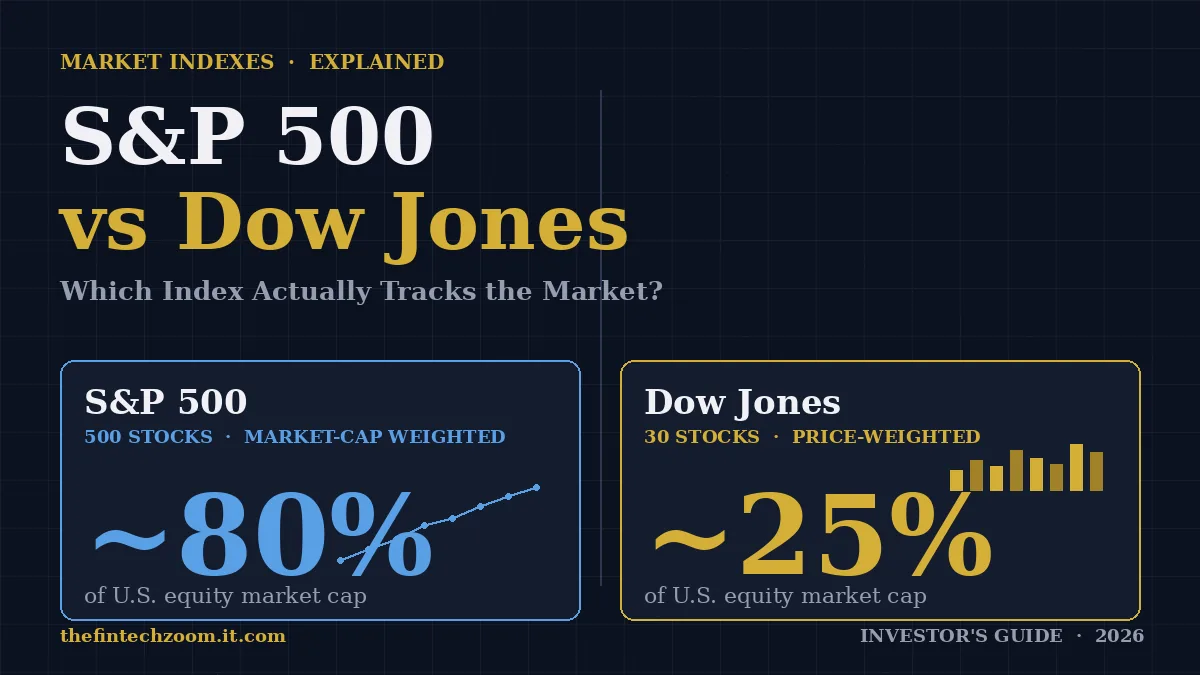
The S&P 500 tracks 500 of the largest U.S. companies, weighted by market capitalization. The Dow Jones Industrial Average tracks only 30 stocks — and weights them by share price, not company size. That structural difference produces two indexes that can move in opposite directions on the same day.
If you’ve wondered why financial professionals almost always cite the S&P 500 as the market benchmark while TV news leads with the Dow, this article answers that directly — and explains which one you should actually be watching.
What Are the S&P 500 and Dow Jones, and Who Controls Them?
Both indexes are managed by S&P Dow Jones Indices, a joint venture between S&P Global and CME Group. The S&P 500 measures approximately 500 large U.S. companies selected by a criteria-based committee. The Dow Jones Industrial Average (DJIA) tracks 30 blue-chip stocks chosen through an editorial process involving The Wall Street Journal. They share a parent company but operate under different rules.
The S&P 500: History and Structure
Standard & Poor’s published its first market index in 1923. The S&P 500 as we know it today launched in 1957 — the first index to use a computer to calculate real-time values.
Today it holds approximately 503 individual stock listings. Some companies appear more than once because they have multiple share classes (Alphabet lists as both GOOGL and GOOG, for example). A selection committee at S&P Dow Jones Indices reviews candidates against strict criteria:
- The company must be U.S.-domiciled
- Market capitalization must exceed $18 billion
- The company must show positive net earnings over the four most recent consecutive quarters
- Shares must meet minimum liquidity and trading volume thresholds
- At least 50% of shares must be publicly available (public float requirement)
Meeting these thresholds doesn’t guarantee inclusion. The committee uses discretion — but the criteria are transparent and published.
The S&P 500 represents roughly 80% of total U.S. equity market capitalization. That single fact explains why professional investors treat it as the default benchmark for American equities.
The Dow Jones Industrial Average: History and Structure
Charles Dow and Edward Jones launched the Dow Jones Industrial Average in 1896. It originally tracked 12 industrial companies — railroads, cotton, gas, tobacco. Only one original member, General Electric, survived in the index into the 21st century, and even GE was removed in 2018.
Today’s 30 Dow components include household names like Apple, Goldman Sachs, UnitedHealth Group, Microsoft, and Home Depot. But the selection process is more subjective than the S&P 500. A committee considers company reputation, growth history, sector representation, and whether the business reflects the broader U.S. economy. There’s no published formula.
This doesn’t make the Dow unreliable — 130 years of history suggests otherwise. But it does make it less transparent about why specific companies are included or excluded.
How Is the S&P 500 Different From the Dow Jones?
The core difference comes down to three things: how many stocks each index holds (500 vs 30), how it weights those stocks (market cap vs share price), and how broadly each covers the economy. The S&P 500 is wider, deeper, and more mathematically precise as a market measure. The Dow is older, simpler, and culturally dominant despite covering less ground.
Here’s the full side-by-side breakdown:
| Feature | S&P 500 | Dow Jones (DJIA) |
|---|---|---|
| Number of components | ~500 | 30 |
| Weighting method | Market-cap weighted | Price-weighted |
| Founded | 1957 (modern form) | 1896 |
| Managed by | S&P Dow Jones Indices | S&P Dow Jones Indices / WSJ |
| % of U.S. market cap covered | ~80% | ~25% |
| Selection method | Committee with published criteria | Editorial committee, no public formula |
| Sector coverage | All 11 GICS sectors | Broad but limited by 30-stock constraint |
| Primary use | Professional benchmarking | Media reporting, public market temperature |
| Popular ETFs | SPY, VOO, IVV | DIA |
Coverage: 500 vs 30 Companies
500 stocks doesn’t sound like a lot against the thousands of publicly traded U.S. companies. But those 500 represent the largest by value, spanning every major industry — and they account for 80% of total market value.
The Dow’s 30 components, by contrast, represent a carefully curated slice. They’re not necessarily the 30 largest companies. They’re 30 companies the selection committee believes represent important segments of the economy. That’s a meaningful distinction.
When a major sector like semiconductor manufacturing, biotech, or energy has a significant move, the Dow may not capture it. The S&P 500 will — because it holds more companies across more subsectors.
How Companies Get In (And Out)
The S&P 500 holds annual and quarterly reviews. Additions happen when companies meet criteria and a spot opens through merger, bankruptcy, or reclassification. Removals happen when a company falls below thresholds or is no longer U.S.-domiciled.
The Dow changes far less frequently. Historically, a DJIA shakeup happens only a handful of times per decade. When Walgreens, 3M, and Dow Inc. were removed and Amazon, Nvidia, and Sherwin-Williams were added in 2024, it made financial news specifically because such changes are rare.
Price-Weighted vs. Market-Cap Weighted: The Distinction That Matters Most
This is the most important technical difference, and most financial media glosses over it. In a price-weighted index like the Dow, a stock with a higher share price has more influence regardless of company size. In a market-cap weighted index like the S&P 500, influence is proportional to total company value. The same company can behave completely differently inside each index depending on its share price versus its market cap.
How Price-Weighting Distorts the Dow
Here’s a concrete example. Suppose Company A trades at $400 per share with a market cap of $200 billion. Company B trades at $100 per share with a market cap of $800 billion. In the Dow, Company A has 4x more influence on the index than Company B — even though Company B is four times larger by actual value.
That’s the problem.
UnitedHealth Group has historically been one of the highest-priced stocks in the Dow. Its price-per-share (regularly above $500) gives it outsized influence over DJIA daily moves. On days when UnitedHealth has a bad earnings report, the Dow can drop significantly even if the broader market is flat or rising.
The Dow manages this through something called the Dow Divisor — a number adjusted whenever a component does a stock split, pays a special dividend, or is swapped out. The current divisor is less than 1, meaning each dollar move in any single Dow component shifts the index level by roughly $0.15 points or more. But the divisor is a patch on the underlying weighting problem, not a solution to it.
Apple’s 2020 Stock Split — A Real-World Illustration
In August 2020, Apple executed a 4-for-1 stock split. Its share price dropped from approximately $480 to about $120 overnight. Apple’s total market capitalization didn’t change — the company was worth the same amount, just divided into more shares.
In the Dow, Apple’s influence on the index dropped by roughly 75% after that split. A stock representing America’s most valuable company suddenly accounted for a fraction of the Dow’s movement that it had the day before.
In the S&P 500? Nothing changed. Apple’s weight in the index remained tied to its market cap — the actual measure of the company’s size. The S&P 500 didn’t notice the split at all in terms of Apple’s index weight.
This is the clearest illustration of why market-cap weighting is considered more rational. Share price is an accounting decision. Market capitalization is an economic reality.
The Concentration Problem in the S&P 500
Market-cap weighting isn’t perfect either. The S&P 500’s top 10 holdings have represented more than 35% of its total weight in recent years — driven almost entirely by mega-cap technology companies. Apple, Microsoft, Nvidia, Amazon, Alphabet, and Meta together account for a disproportionate share of what’s supposed to be a 500-stock index.
This means buying an S&P 500 index fund is not the same as spreading your money equally across 500 companies. You’re buying a portfolio tilted heavily toward Big Tech.
That’s a known trade-off, and one most professional investors accept because market-cap weighting still reflects market reality better than price-weighting. But it’s worth understanding before assuming the S&P 500 is perfectly diversified.
Which Index Better Reflects the U.S. Stock Market?
The S&P 500 is the professional standard for measuring U.S. equity performance. It covers 80% of U.S. market cap across all sectors, uses market-cap weighting, and has published selection criteria. The Dow Jones is more useful as a directional reading than a precise market measure — a quick gauge of whether large blue-chip companies are broadly up or down, not a comprehensive picture of what the market is doing.
When the Two Indexes Diverge — and Why It Matters
Over long periods, the S&P 500 and Dow Jones tend to move in roughly the same direction. Both track large-cap U.S. equities, and macro forces — interest rates, GDP growth, corporate earnings — affect both.
But they diverge more often than most investors realize. In late 2023 and early 2024, the S&P 500 was significantly outpacing the Dow. The technology sector — heavily represented in the S&P 500 — was driving the bulk of market gains. The Dow’s 30 components, with a different sector composition, didn’t capture those tech-driven moves with the same intensity.
Someone watching only the Dow during that period saw a more muted version of the rally. Someone watching the S&P 500 saw a more accurate picture of what was actually happening in markets.
How Institutions Use Each Index
Institutional investors — pension funds, endowments, mutual funds — benchmark portfolio performance against the S&P 500. When a fund manager says they “beat the market,” they almost always mean they outperformed the S&P 500 total return index, not the Dow.
Index funds tracking the S&P 500 are among the most widely held investments in the world. Vanguard’s VOO and BlackRock’s IVV each hold hundreds of billions in assets. The SPDR S&P 500 ETF (SPY), launched in 1993, was the first ETF ever listed in the U.S. and remains one of the most traded securities on Earth.
Warren Buffett has recommended low-cost S&P 500 index funds for retail investors repeatedly and publicly — most notably in Berkshire Hathaway shareholder letters and his 2013 will, where he instructed the trustee managing assets for his wife to put 90% in a low-cost S&P 500 fund. He has never made the same recommendation for Dow-tracking funds.
Why the Dow Still Dominates Media Coverage
If the S&P 500 is more accurate, why do news channels lead with “the Dow gained 400 points”?
History, primarily. The Dow is 130 years old. It embedded itself in American financial consciousness long before the S&P 500 existed in its modern form. Baby boomers grew up hearing about “the Dow” as the market. News directors inherited that language.
There’s also a presentational advantage: 30 stocks are easier to explain than 500. “The 30 biggest companies in America are up” is a clean headline even if it’s imprecise. The Dow’s single daily number gives producers a simple story.
That cultural momentum isn’t going away. But for anyone making investment decisions, the S&P 500 is the number that matters.
Common Mistakes Investors Make When Reading These Two Indexes
The biggest mistake is treating the Dow as a comprehensive market reading. With 30 stocks, the Dow can rise on a day when the broad market falls — and fall when the broad market rises. Other common errors include comparing point moves between indexes as if they’re equivalent, assuming S&P 500 index funds are fully diversified, and ignoring the difference between price return and total return when comparing long-term performance.
Mistake 1: “The Dow Is Up, So the Market Is Up”
On any given day, three or four high-priced Dow components can push the index upward while hundreds of other stocks are flat or declining. If UnitedHealth Group, Goldman Sachs, and Home Depot have strong individual days, the Dow can gain 300 points while the Russell 2000 (small-cap index) drops 1%.
That’s not a market-wide rally. That’s three companies having good days.
The S&P 500 is harder to pull in one direction by a handful of stocks, simply because 500 stocks must broadly agree to move the index significantly.
Mistake 2: Comparing Point Moves, Not Percentages
“The Dow dropped 500 points” sounds catastrophic. Whether it is depends entirely on where the Dow is sitting. A 500-point drop from 40,000 is 1.25%. The same drop from 10,000 would be 5%.
Always convert to percentage when reading index moves. A 1% move in the Dow and a 1% move in the S&P 500 on the same day are comparable. A 400-point Dow move and a 50-point S&P 500 move might represent nearly identical percentages — or wildly different ones.
This also matters when comparing the two indexes over time. Looking at raw point levels tells you almost nothing useful.
Mistake 3: Assuming S&P 500 Funds Are Fully Diversified
Buying a broad-market S&P 500 index fund is one of the most evidence-backed investment moves a retail investor can make. But it’s not the same as diversifying equally across 500 companies.
As of recent years, the top five holdings — Apple, Microsoft, Nvidia, Amazon, and Alphabet — have represented more than 25% of the index’s total weight on their own. A $10,000 investment in an S&P 500 fund puts roughly $2,500 in five companies and the remaining $7,500 across the other 495.
Investors who want to reduce that Big Tech concentration sometimes pair S&P 500 exposure with equal-weight funds (like RSP, which holds all 500 S&P components at roughly equal weights), small-cap funds, or international equity.
Mistake 4: Comparing Price Return Instead of Total Return
Both the S&P 500 and the DJIA are typically reported as price return indexes — meaning dividends are not included in the headline number. But dividends matter significantly over long periods.
The S&P 500’s total return (with dividends reinvested) has historically run about 1.5–2 percentage points per year higher than its price return alone. Over 20 or 30 years, that difference compounds dramatically. When someone compares the “S&P 500 vs Dow Jones” over a 20-year period, they need to ensure they’re comparing the same return type — or the comparison is meaningless.
Frequently Asked Questions
Is the S&P 500 better than the Dow Jones for tracking the market?
For measuring overall U.S. stock market performance, yes. The S&P 500 covers roughly 80% of total U.S. equity market cap across all major sectors, using market-cap weighting that reflects actual company size. The Dow tracks 30 price-weighted stocks and provides a narrower, less precise reading. Financial professionals universally use the S&P 500 as the primary benchmark.
Why do news networks still report the Dow more than the S&P 500?
Mostly habit and history. The Dow has been part of American financial reporting since 1896, predating the modern S&P 500 by six decades. Its 30-stock simplicity also makes it easier to explain in a 15-second broadcast segment. The S&P 500 eventually became the professional standard, but the Dow’s cultural dominance in mainstream media hasn’t shifted.
Can the Dow and S&P 500 move in opposite directions on the same day?
Yes, they can — and occasionally do. If a handful of high-priced Dow components have strong days while broader market sectors decline, the Dow can rise while the S&P 500 falls. The divergence is more pronounced when sector-specific news (a drug approval, a bank earnings miss, a semiconductor supply story) affects Dow components differently than the broader index.
Which index should I use to benchmark my portfolio?
Use the S&P 500. It’s the standard benchmark for U.S. equity performance among professional investors, fund managers, and financial researchers. If you hold a diversified U.S. equity fund, it almost certainly benchmarks against the S&P 500. The Dow is useful as a general directional signal, not a performance yardstick.
What are the best S&P 500 and Dow Jones index funds?
The most widely held S&P 500 ETFs are SPY (SPDR, launched 1993), VOO (Vanguard), and IVV (iShares). All track the same index with slightly different expense ratios. For the Dow Jones, the primary ETF is DIA (SPDR Dow Jones Industrial Average ETF Trust). S&P 500 funds dominate by assets under management — VOO alone holds over $1 trillion.
Does the S&P 500 include international companies?
No. The S&P 500 requires companies to be U.S.-domiciled. However, many of those companies generate substantial international revenue — Apple earns more than half its revenue outside the U.S., and many S&P 500 multinationals have similar profiles. The index is domestic by composition but globally exposed by revenue.
What happens to an S&P 500 index fund when a new stock is added to the index?
Every index fund tracking the S&P 500 must buy shares of the newly added company to keep pace with the index. This buying pressure typically pushes the stock’s price higher in the days surrounding the announcement and the effective inclusion date. Removal creates the opposite pressure. This “index inclusion effect” is well-documented in academic finance research and creates short-term price distortions around rebalancing events.
How often do components change in each index?
The S&P 500 rebalances quarterly, with additions and removals happening throughout the year as companies meet or fall short of criteria. The Dow changes far less — sometimes only once or twice in a decade. In 2024, Amazon, Nvidia, and Sherwin-Williams replaced Walgreens, 3M, and Dow Inc. in the DJIA, which was notable specifically because such changes are rare.
The Bottom Line
The S&P 500 and Dow Jones are not interchangeable. One tracks 500 companies weighted by market size across the entire U.S. economy. The other tracks 30 companies weighted by share price — a method that introduces distortions the S&P 500 specifically avoids.
For investors, the practical conclusion is clear: use the S&P 500 as your market benchmark. Track the Dow for context, not decisions.
The structural differences also point toward the right investment vehicle. Low-cost S&P 500 index funds — SPY, VOO, IVV — give you exposure to 80% of the U.S. equity market in a single position, with expense ratios often below 0.05%. That’s why they’re the most widely held securities in existence.
Understanding which index is measuring what doesn’t make you a professional investor. But it stops you from being misled by a 400-point Dow headline while the actual market is doing something completely different.
This article is published by TheFintechZoom for educational purposes and does not constitute investment advice. All investing involves risk, including the potential loss of principal.