Most investors use “Nasdaq” and “S&P 500” to mean the same thing — “how the market did today.” That imprecision isn’t just sloppy; it leads to actual portfolio mistakes.
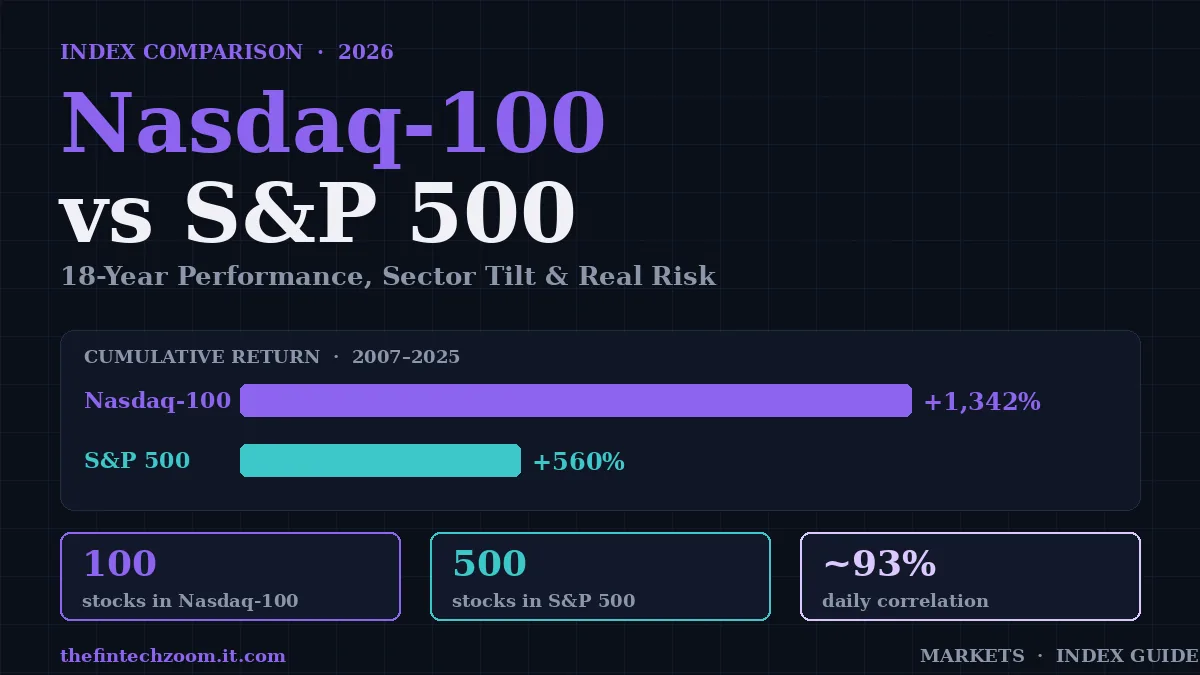
The Nasdaq vs S&P 500 difference goes well beyond stock counts. These two indexes are built on different rules, hold different sectors, and behave in meaningfully different ways when markets get volatile. Since 2007, the Nasdaq-100 has delivered a cumulative return of 1,342% compared to the S&P 500’s 560% — but it also fell nearly twice as hard in 2022 when tech stocks unraveled.
This guide covers exactly what separates these two indexes: how they’re built, what they hold, how their returns compare with real data, which ETFs let you invest in each, and the mistakes most investors make when comparing them. No filler. Just the stuff that actually affects your money.
What Are the Nasdaq and S&P 500, Actually?
The Nasdaq is a stock exchange. The S&P 500 is an index. That’s the foundational distinction most finance articles skip. The Nasdaq (short for National Association of Securities Dealers Automated Quotations) launched in 1971 as the world’s first fully electronic marketplace for buying and selling stocks. The S&P 500 is a list — a curated index of 500 companies selected by a committee at S&P Global.
When financial media say “the Nasdaq rose 1.2% today,” they typically mean the Nasdaq Composite Index (ticker: IXIC), which tracks every common stock listed on the Nasdaq exchange. As of May 2026, that’s roughly 7,000 securities — a genuinely broad measure of everything from micro-cap biotech startups to trillion-dollar technology companies.
But that’s not the version most individual investors actually own. The index you’re more likely to encounter in your brokerage account is the Nasdaq-100 (ticker: NDX), which tracks only the 100 largest non-financial companies listed on the Nasdaq. Apple, Microsoft, NVIDIA, Amazon, Meta, and Alphabet sit at the top. This is what the popular Invesco QQQ ETF tracks.
The S&P 500 (ticker: SPX) was introduced by Standard & Poor’s in 1957. It measures 500 of the largest publicly traded U.S. companies across all major sectors — technology, healthcare, financials, energy, consumer staples, utilities, and more. Crucially, companies don’t have to be listed on Nasdaq to qualify; the NYSE and CBOE are equally eligible exchanges.
Here’s why this matters in practice: when Apple and Microsoft show up in both the Nasdaq-100 and the S&P 500, you’d think the two would behave almost identically. They don’t — because the other 400+ slots in the S&P 500 are filled with banks, oil companies, pharmaceutical giants, and consumer brands that rarely appear in Nasdaq-heavy discussions.
How Each Index Decides Which Stocks to Include
The S&P 500 applies stricter, more deliberate selection criteria than the Nasdaq-100. Understanding those criteria explains a lot about why the two indexes diverge.
S&P 500 Membership Rules
To be added to the S&P 500, a company must clear the following bar:
- U.S. domicile: Incorporated and headquartered in the United States, with a primary listing on an eligible U.S. exchange (NYSE, Nasdaq, or CBOE).
- Market capitalization: As of early 2025, S&P Dow Jones Indices updated the minimum threshold to $20.5 billion for new additions — reviewed and adjusted quarterly to reflect current market conditions.
- Profitability: Positive net earnings in the most recent quarter, and positive cumulative earnings over the prior four quarters combined. This is the rule that kept Tesla out of the index until December 2020, despite its enormous market cap in the years prior.
- Liquidity: Shares must be highly liquid, with at least 50% of outstanding shares available as public float.
- Trading history: At least 12 months of trading as a listed company.
Selection is also discretionary — a committee at S&P Global makes the final call. This human oversight is part of why the S&P 500 is often called a “quality-screened” index, not just a pure market-cap ranking.
Nasdaq-100 Membership Rules
The Nasdaq-100’s criteria are simpler and don’t include a profitability test:
- Must be listed on the Nasdaq exchange for at least three months.
- Average daily trading volume of at least 200,000 shares.
- Must rank among the 100 largest non-financial companies by market capitalization on the exchange.
- No financial companies allowed — banks, insurance firms, and asset managers are excluded by design.
That last point is structural, not incidental. The Nasdaq-100 was built to represent innovation-focused and technology companies. It excludes the entire financial sector, which accounts for roughly 13% of the S&P 500.
The absence of a profitability screen means earlier-stage growth companies can enter the Nasdaq-100. This is one reason the index tends to hold more volatile, higher-ceiling positions than the S&P 500.
Weighting Methodology
Both indexes use market-capitalization weighting — larger companies exert more influence on daily index movements. But there’s a practical difference. The Nasdaq-100 employs a modified market-cap weighting that applies caps to its largest constituents, preventing any single stock from dominating the index beyond certain thresholds. The S&P 500 uses standard float-adjusted market-cap weighting without the same caps.
In both cases, the result is still heavily concentrated at the top: the five largest holdings in either index account for a substantial share of total weight. That’s worth knowing when someone tells you the S&P 500 is “more diversified.”
Nasdaq vs S&P 500 Performance: What the Data Actually Shows
Over the 18-year period from December 31, 2007 to December 31, 2025, the Nasdaq-100 returned 1,342% cumulatively, compared to 560% for the S&P 500 — an annualized gap of 5 percentage points (16.0% vs 11.0%) according to Nasdaq Global Indexes’ official Q4 2025 factsheet.
That 5-point annual gap sounds modest. Over 18 years, it produces a difference of more than 2.4x in total wealth accumulated. On a $50,000 investment, that gap means roughly $670,000 vs $280,000 — before taxes and fees.
Year-by-Year Patterns
The Nasdaq-100 outperformed the S&P 500 in 14 of those 18 calendar years. But the four years where it didn’t underperform — particularly 2022 — illustrate the real cost of sector concentration.
2023 was the Nasdaq-100’s best year since 1999, surging 55.1% as AI-focused companies (particularly NVIDIA, which rose roughly 240% that year) rewarded concentrated tech exposure. The S&P 500 posted a solid ~26%.
2022 delivered the sharpest reminder of the other side. Rising interest rates compressed valuations on high-growth stocks. The Nasdaq-100 dropped roughly 33%. The S&P 500 fell around 18%. Investors in the Nasdaq-100 who bought at the 2021 peak needed approximately 18 months to recover their principal. S&P 500 investors recovered faster.
Volatility and Correlation
Here’s a number that surprises most people: the daily return correlation between the Nasdaq-100 and S&P 500 is approximately 93%, according to Nasdaq’s own research covering the same 18-year period. They move in the same direction on the vast majority of trading days.
The annualized volatility difference is also smaller than most investors expect:
- Nasdaq-100 annualized volatility: 22.9%
- S&P 500 annualized volatility: 20.1%
- Difference: 2.9 percentage points
That’s a real but not dramatic difference. The Nasdaq-100 isn’t twice as volatile as the S&P 500 — it’s moderately more volatile, with a historically meaningful return premium for bearing that extra risk.
Sector Composition: The Actual Driver
| Sector | Nasdaq-100 Weight | S&P 500 Weight |
|---|---|---|
| Information Technology | ~55–60% | ~35% |
| Consumer Discretionary | ~10–12% | ~10% |
| Communication Services | ~8–10% | ~8–9% |
| Healthcare | ~6–8% | ~12% |
| Financials | 0% | ~13% |
| Energy | 0% | ~4–5% |
| Industrials | ~2–3% | ~8% |
| Consumer Staples | <1% | ~6% |
| All Other | ~5% | ~5% |
Approximate weights based on publicly available data as of late 2025/early 2026. Weights fluctuate with market movements.
The sector table reveals the real story. The Nasdaq-100’s 55-60% technology weighting is the primary driver of both its outperformance in tech bull markets and its deeper drawdowns when interest rates rise or sentiment shifts away from growth. The S&P 500’s inclusion of financials, energy, and consumer staples provides ballast that the Nasdaq-100 simply doesn’t have.
When tech runs, the Nasdaq-100 accelerates. When it stumbles, there’s less diversification to cushion the fall.
How to Actually Invest in These Indexes
You can’t buy an index directly. You invest through exchange-traded funds (ETFs) or index mutual funds that replicate the index’s holdings. Here’s the practical landscape:
ETF Comparison: QQQ vs SPY vs VOO
| Index | ETF | Issuer | Expense Ratio | Dividend Yield |
|---|---|---|---|---|
| Nasdaq-100 | QQQ | Invesco | 0.18% | ~0.46% |
| Nasdaq-100 | QQQM | Invesco | 0.15% | ~0.46% |
| S&P 500 | SPY | State Street | 0.09% | ~1.08% |
| S&P 500 | VOO | Vanguard | 0.03% | ~1.13% |
| S&P 500 | IVV | BlackRock | 0.03% | ~1.10% |
Data sourced from TipRanks and PortfoliosLab as of 2026. Expense ratios and yields subject to change.
The expense ratio gap matters more than most investors appreciate. Paying 0.18% (QQQ) instead of 0.03% (VOO or IVV) on a $100,000 portfolio costs approximately $150 per year in fees. Over 20 years, with compounding, that difference adds up to thousands of dollars in lost returns — for the same underlying exposure, if you were comparing two S&P 500 funds.
For Nasdaq-100 exposure, the choice between QQQ and QQQM is mainly a liquidity vs cost trade-off. QQQ is one of the world’s most traded ETFs — useful for active traders who need tight bid-ask spreads. QQQM is the same underlying index at a slightly lower fee and was designed specifically for long-term buy-and-hold investors. If you’re holding in a retirement account and not trading frequently, QQQM makes more sense.
On dividends: The Nasdaq-100’s 0.46% yield reflects the growth-company orientation — Apple, NVIDIA, and Meta reinvest most of their profits. S&P 500 ETFs yield over 1%, which matters if you’re building income alongside growth. Neither fund is designed as a dividend play, but the S&P 500’s broader sector mix naturally generates more income.
Over the past 10 years, QQQ has returned approximately 21.6% annualized vs 15.3% annualized for VOO, per PortfoliosLab data — but those backward-looking numbers say nothing about the next decade. Past sector tailwinds don’t repeat on schedule.
Mistakes Investors Make When Comparing These Two
Mistake 1: Conflating “the Nasdaq” with the Nasdaq-100
When a financial news anchor says “the Nasdaq fell 1.5% today,” they’re quoting the Nasdaq Composite — roughly 7,000 stocks across all sectors. QQQ tracks the Nasdaq-100, which is 100 stocks. The performance of the two frequently diverges, especially when small- and mid-cap stocks move differently from large caps, or when financial stocks (included in the Composite but not the Nasdaq-100) make significant moves.
Mistake 2: Assuming the Nasdaq-100’s long-term lead is guaranteed
The 18-year performance advantage is real. What makes it a risky assumption to extrapolate is that it’s concentrated in a single sector. The 1999–2002 period saw the Nasdaq Composite fall approximately 78% from peak to trough during the dot-com crash. The S&P 500 fell roughly 49% in the same period. If technology valuations contract significantly from current levels, the Nasdaq-100 bears a proportionally larger impact. Past outperformance was largely the result of one specific secular trend — technology becoming the dominant force in the global economy. Whether that continues at the same pace is an open question.
Mistake 3: Treating the S&P 500 as fully diversified
The word “diversified” gets used too loosely here. The S&P 500’s 500-stock universe sounds comprehensive, but since it’s market-cap weighted, Apple and Microsoft alone account for roughly 14% of the entire index as of 2026. The top 10 holdings — nearly identical to QQQ’s top 10 — can make up 35%+ of the total index weight. The S&P 500 is more diversified by sector, not necessarily by concentration of individual names.
Mistake 4: Thinking they can’t be held together
These indexes are not an either/or decision. Many long-term portfolios hold a core S&P 500 position (VOO or IVV) alongside a Nasdaq-100 position (QQQ or QQQM) to get broad market exposure with a deliberate technology tilt. A portfolio structured as 70% S&P 500 / 30% Nasdaq-100 is a reasonable approach for an investor who wants market-wide coverage but believes technology and innovation companies will continue to drive outsized growth. The precise allocation depends on your risk tolerance and time horizon.
Myth: The S&P 500 is always “safer”
Safer in terms of sector balance, yes. But the S&P 500 still lost roughly 38% in 2008 during the financial crisis. No large-cap U.S. index is a safe-haven asset. Both indexes are equity exposures and carry significant downside risk in sustained bear markets. The difference in safety is a matter of degree, not kind.
Frequently Asked Questions
What is the main difference between Nasdaq and S&P 500?
The Nasdaq is a stock exchange; the S&P 500 is a committee-selected index. When investors compare them as indexes, the key differences are sector composition (the Nasdaq-100 is heavily tech-weighted; the S&P 500 is broader), membership criteria (the S&P 500 requires profitability; the Nasdaq-100 does not), and the complete exclusion of financial companies from the Nasdaq-100. Both use market-cap weighting, but for different universes of stocks.
Does the Nasdaq always outperform the S&P 500?
Not always, but historically more often than not. The Nasdaq-100 outperformed the S&P 500 in 14 of 18 calendar years from 2007 to 2025 and delivered annualized returns of 16.0% vs 11.0% over that period. The significant exception was 2022, when rising interest rates hit growth stocks hard and the Nasdaq-100 fell roughly twice as much as the S&P 500. Long-term, the Nasdaq-100 has had the edge — with meaningfully higher volatility along the way.
Can I invest in both the Nasdaq and S&P 500?
Yes. You can hold QQQ (or QQQM) alongside VOO, SPY, or IVV in any standard brokerage or retirement account. Many investors do exactly this — using the S&P 500 as a broad market foundation and the Nasdaq-100 as a tech-growth tilt. There’s no rule requiring you to pick one or the other.
Which is better for long-term investors: Nasdaq-100 or S&P 500?
This depends on your risk tolerance and conviction. If you have a 10+ year horizon and can stomach deeper short-term drawdowns, the Nasdaq-100’s historical return premium has been real. If you want steadier diversification across the full U.S. economy — including financials, healthcare, energy, and consumer sectors — the S&P 500 is more balanced. Neither is universally “better”; they serve different risk-return profiles.
Why does the Nasdaq-100 exclude financial companies?
The Nasdaq-100 was deliberately designed to represent the largest non-financial companies on the Nasdaq exchange, with a focus on technology and innovation-driven sectors. Financial companies — banks, insurance firms, brokerage firms — are structurally excluded. This design choice means the Nasdaq-100 has no buffer from financial-sector performance, which tends to move differently from tech during rate cycles. The S&P 500 has no such exclusion and holds roughly 13% in financials.
What ETFs track the Nasdaq-100 and S&P 500?
The Nasdaq-100 is tracked by QQQ (Invesco, 0.18% expense ratio) and QQQM (Invesco, 0.15%) — QQQM is the better option for most long-term, buy-and-hold investors due to its lower fee. The S&P 500 is tracked by SPY (State Street, 0.09%), VOO (Vanguard, 0.03%), and IVV (BlackRock, 0.03%). For pure cost efficiency, VOO and IVV are meaningfully cheaper than SPY for the same S&P 500 exposure.
How many stocks are in the Nasdaq Composite vs the S&P 500?
The Nasdaq Composite tracks approximately 7,000 securities listed on the Nasdaq exchange as of 2026. The S&P 500 holds 500 stocks selected by a committee, listed on any major U.S. exchange. The Nasdaq-100 — the version most retail investors actually own through ETFs like QQQ — tracks the 100 largest non-financial companies among those 7,000.
Does the S&P 500 include companies listed on Nasdaq?
Yes. The S&P 500 is exchange-agnostic. It includes companies listed on the NYSE, Nasdaq, and CBOE, as long as they meet the index’s eligibility criteria. Apple, Microsoft, Alphabet, Amazon, and NVIDIA are listed on Nasdaq but also included in the S&P 500. This is why the top holdings of both the Nasdaq-100 and S&P 500 look similar — it’s the other 400+ slots in the S&P 500 that create the sector difference.
The Bottom Line
The Nasdaq vs S&P 500 difference is not a question of which one is universally better. It’s a question of what you’re buying when you choose one over the other.
The Nasdaq-100 gives you concentrated exposure to the companies that have driven the tech revolution — at higher historical returns, higher volatility, and with no financial sector exposure to smooth out rate cycles. The S&P 500 gives you a committee-selected snapshot of the U.S. economy’s 500 most established, profitable companies, with sector balance that has historically cushioned downturns better.
Most investors who track both closely end up holding both — using the S&P 500 as their core and the Nasdaq-100 as a growth overlay. Whether that ratio is 80/20, 70/30, or 50/50 depends on your timeline, your risk capacity, and your view of where the next decade’s returns will come from.
Your next step: If you’re starting from scratch, open a brokerage account that offers zero-commission trading (most major platforms do), and compare VOO versus QQQ directly using a fee and return calculator. Run both with your intended investment amount over your expected time horizon. The numbers will clarify the trade-off better than any article can.
This guide reflects publicly available index data and ETF information as of 2026. It is for educational purposes only and does not constitute investment advice. Always consult a licensed financial professional before making investment decisions.