The S&P 500 trades roughly 5 billion shares on a typical session. By the closing bell, the index has usually moved a fraction of a percent — but inside that small number sit thousands of news triggers, algorithmic reactions, and human emotions all competing for influence.
Most explanations you read after the close are written backward. A reporter sees the market closed down 0.4%, picks the most dramatic headline of the day, and calls it the “reason.” That story rarely matches what actually drove prices.
This guide breaks down what really moves the stock market each day — the data releases, central bank decisions, earnings reactions, and positioning shifts that traders are watching minute by minute. You’ll learn how a trading day is structured, which economic reports genuinely matter, where beginners get tricked by media narratives, and how to read daily moves without falling for false explanations.
What actually moves the stock market each day?
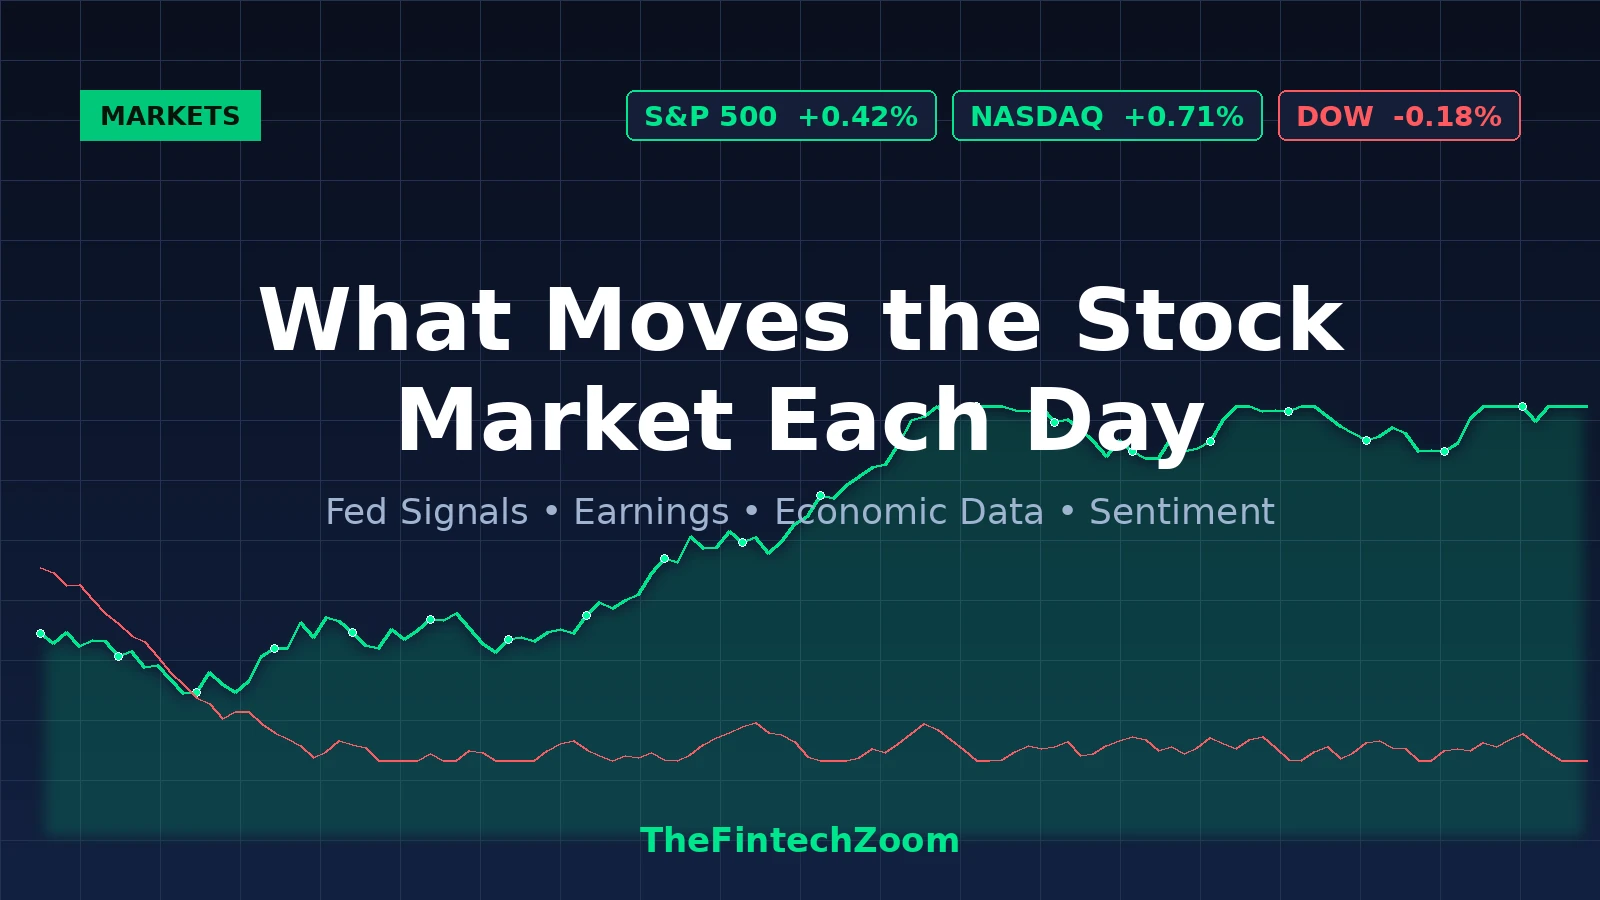
The stock market moves each day because of supply and demand for shares, but the deeper drivers are five forces working together: economic data surprises, central bank policy signals, corporate earnings and guidance, geopolitical events, and investor sentiment and positioning. On any given day, one or two of these dominate.
Supply and demand is the mechanism. When more capital wants to buy than sell at the current price, the price rises until enough sellers show up. When the reverse happens, prices fall. That much is uncontroversial. The harder question is what makes investors collectively want to buy or sell at any given moment.
In my experience tracking daily market reactions for finance readers, the honest answer is that most days are driven by expectations being revised, not by news itself. A “good” jobs report can crash the market if it was supposed to be even better. A weak earnings report can rally a stock if Wall Street had braced for worse. The market trades the surprise, not the headline.
A 2008 New York Fed study by Bartolini, Goldberg, and Sacarny found that out of 13 closely watched economic indicators, only a handful — nonfarm payrolls, the advance GDP release, and a private manufacturing report — produced significant and persistent effects on stock prices. Most other releases caused only short-lived or erratic responses. The implication: a lot of the daily noise you read about doesn’t actually move the index in any lasting way.
The five real daily drivers, ranked roughly by impact:
- Federal Reserve and central bank actions — interest rate decisions, FOMC statement language, and speeches by voting members.
- Major economic data surprises — Nonfarm Payrolls (NFP), CPI inflation, PCE, GDP, ISM Manufacturing, retail sales.
- Corporate earnings and forward guidance — especially from mega-cap stocks that carry index weight.
- Geopolitical and policy shocks — wars, tariff announcements, elections, oil supply disruptions.
- Positioning and sentiment — what big institutional players are already long or short going into an event.
The fifth one is the least visible and the most underrated. Markets often move opposite to news because traders had already positioned for that news. This is why “buy the rumor, sell the news” exists as a saying — and why beginners get blindsided.
How does a typical trading day actually unfold?
A standard U.S. trading day moves in predictable phases. Pre-market futures react to overnight news from Asia and Europe. The opening 30 minutes carry the heaviest volume. Midday goes quiet. The final hour, often called the “power hour,” sees the most institutional repositioning before close. Each phase has its own typical drivers.
Here’s how I walk through a session when analyzing market moves:
Pre-market (4:00 a.m. – 9:30 a.m. ET)
The futures markets — primarily the S&P 500 E-mini (ES) and Nasdaq 100 (NQ) — never really sleep. From the moment Asian markets opened the previous evening, futures have been digesting news.
By 8:30 a.m. ET, the U.S. Bureau of Labor Statistics or Bureau of Economic Analysis often releases major data (CPI, NFP, GDP, retail sales). Futures move sharply in the seconds after these releases. By 9:00 a.m., big-cap earnings have usually been digested too.
This is also when retail traders are still asleep. The early move is set by hedge funds, market makers, and algorithms reacting to the data surprise versus consensus.
The opening 30 minutes (9:30 a.m. – 10:00 a.m. ET)
The first half-hour is the most volatile period of the day. Overnight orders unwind, gaps fill, and retail traders pile in. Volume in the first 30 minutes often exceeds the entire lunch period combined.
This is where most “headline reactions” finish playing out. If the market gapped down on a bad CPI print, by 10 a.m. the immediate panic is usually priced in.
Mid-morning to lunch (10:00 a.m. – 12:00 p.m. ET)
A second wave of economic releases hits at 10:00 a.m. ET — ISM Manufacturing, JOLTS job openings, consumer confidence. Sector rotation often becomes visible here as institutions adjust portfolios.
The lunch lull (12:00 p.m. – 2:00 p.m. ET)
Volume drops. Trends from the morning either continue quietly or reverse on thin liquidity. Many big traders are away from desks. This is when small news can cause outsized moves simply because fewer participants are around to absorb them.
On Fed meeting days, the 2:00 p.m. ET FOMC statement breaks this calm with the single most impactful release of any given month.
Power hour (3:00 p.m. – 4:00 p.m. ET)
Institutions rebalance, options market makers hedge into close, and end-of-day Market-on-Close (MOC) orders post. The S&P 500 often makes a sharper directional move in the final hour than during the entire midday session.
After-hours (4:00 p.m. – 8:00 p.m. ET)
Earnings reports from major companies — Apple, Microsoft, Nvidia, Tesla, Meta — typically release after the close. Their stock reactions ripple into the next morning’s futures, setting up the following day.
Once you watch this rhythm for a few weeks, daily moves stop feeling random.
Which economic reports actually move stocks the most?
The economic reports that move the stock market most consistently are the FOMC rate decision, Nonfarm Payrolls, CPI inflation, the Fed’s preferred PCE inflation gauge, and advance GDP. These releases regularly produce 1%+ index moves in minutes. Most other reports cause smaller or shorter-lived reactions.
Here’s a comparison of the major releases and what to expect:
| Report | Frequency | Release Time (ET) | Typical Market Impact |
|---|---|---|---|
| FOMC Rate Decision + Statement | 8 times per year | 2:00 p.m. | Very High — often 1–3% S&P move |
| Nonfarm Payrolls (NFP) | Monthly (1st Friday) | 8:30 a.m. | Very High — sharp opening moves |
| CPI (Consumer Price Index) | Monthly | 8:30 a.m. | Very High — drives Fed expectations |
| Core PCE Price Index | Monthly | 8:30 a.m. | High — Fed’s preferred inflation gauge |
| Advance GDP | Quarterly | 8:30 a.m. | High — confirms growth trajectory |
| Retail Sales | Monthly | 8:30 a.m. | Moderate — consumer health proxy |
| ISM Manufacturing PMI | Monthly | 10:00 a.m. | Moderate to High |
| JOLTS Job Openings | Monthly | 10:00 a.m. | Moderate — labor tightness signal |
| Consumer Confidence | Monthly | 10:00 a.m. | Low to Moderate |
| Initial Jobless Claims | Weekly (Thursday) | 8:30 a.m. | Low — unless trend shifts sharply |
A few practical notes from watching these in real time:
- Surprise size matters more than absolute value. A CPI print of 3.2% is bullish if consensus was 3.5%, and bearish if consensus was 3.0%. Always check the expected number, not just the actual.
- Revisions to prior data can move markets as much as the current month. A weak NFP that revises last month upward often nets out neutral.
- Wages inside the NFP report sometimes matter more than the headline. Strong wage growth signals stickier inflation, which the Fed reacts to.
- The bond market reacts first. Watch the 10-year Treasury yield — equity moves often follow yields with a lag of seconds to hours.
The lesson from the NY Fed research is worth repeating: ignore the noise from second-tier releases. Pending home sales, factory orders, regional Fed surveys — these rarely move the broader index in any meaningful way.
How do earnings season and Fed days actually move the market?
Earnings season moves the stock market through forward guidance more than past results, while Fed days move markets through the language of the FOMC statement and the dot plot rather than the rate decision itself. Both events trade on expectations versus reality, not the raw numbers.
Earnings season mechanics
Earnings season runs four times a year, roughly two to six weeks after each quarter ends. Roughly 75% of S&P 500 companies beat earnings estimates in any given quarter — beats are the norm, not the exception. So a beat alone doesn’t move a stock much. What moves it:
- Guidance for the next quarter or full year. If a company beats Q2 but lowers Q3 guidance, the stock usually falls.
- Margins and segment trends. A revenue beat with shrinking gross margins reads as weakness.
- Mega-cap influence on the index. The “Magnificent Seven” alone account for a large slice of the S&P 500’s weight. When Nvidia or Apple reports, the entire index moves with it.
In my work tracking earnings reactions, I’ve seen consistent patterns: a stock that gaps up 5% on earnings often gives back half of that move within three trading days as the initial enthusiasm meets reality. A stock that gaps down on earnings tends to drift lower for longer. This isn’t a rule, but it’s a tendency worth watching.
Fed day mechanics
Fed days happen eight times per year. The sequence runs:
- 2:00 p.m. ET — Statement release. Algorithms scan it within milliseconds for word changes from the previous statement.
- 2:00 p.m. ET — Summary of Economic Projections (SEP), quarterly. The famous “dot plot” showing each FOMC member’s rate expectations.
- 2:30 p.m. ET — Press conference. The Fed Chair answers questions, and an offhand sentence can move markets several percent.
The actual rate decision is usually priced in well before the meeting. CME’s FedWatch tool shows probabilities derived from futures markets, and surprises are rare. What’s not priced in is the tone — whether the Fed sounds dovish (leaning toward cuts) or hawkish (leaning toward holds or hikes).
A classic example: a Fed meeting where rates are held steady as expected, but the Chair signals concern about persistent inflation. The S&P often drops 1–2% in the 30 minutes after the press conference, even though nothing technically “changed.”
What mistakes do beginners make about daily market moves?
The biggest mistakes beginners make about daily market moves are believing media headlines explain the move, trading reactively after the move has already happened, ignoring positioning data, and treating coincidence as causation. Avoiding these traps separates informed investors from reactive ones.
Here are the most common errors I see — and how to think about each:
1. Trusting the post-close narrative
Financial journalist Peter Cohan once pointed out that markets fall and reporters scramble to find a reason that fits the day’s biggest headline. The headline becomes the “cause” by association, even when the timing doesn’t fit.
I’ve watched markets drop 1% before a “bad” news event was even released, then journalists credit that news after the fact. Always check the timestamp of the move versus the timestamp of the news.
2. Reacting to news after the open
If you see a “stocks fall on inflation fears” headline at 11 a.m., that move was over by 9:31 a.m. Retail traders who sell at 11 a.m. typically sell near the local low and miss the bounce. The market has already priced in the obvious read of the news.
3. Ignoring positioning
If hedge funds are heavily short going into a Fed meeting and the Fed sounds mildly hawkish, the market can still rally — because shorts cover. Positioning data from sources like the CFTC Commitment of Traders report explains many “weird” reactions.
4. Confusing one stock with the market
A 3% drop in Tesla on a bad delivery number doesn’t mean the market is bearish. The S&P 500 has 500 components. Sector and breadth matter — look at the equal-weighted S&P (RSP) versus the cap-weighted version to gauge whether moves are broad or concentrated.
5. Believing the market is “rational” every day
Markets are rational over years, often irrational over weeks, and frequently random over single days. Trying to assign meaning to every 0.3% daily move is a recipe for overtrading and burnout.
6. Watching CNBC instead of the data
Television finance coverage prioritizes drama. The actual moves are usually small, mechanical, and driven by data releases you can track yourself on a free economic calendar. Cut the noise.
Frequently Asked Questions
What time of day is the stock market most volatile?
The U.S. stock market is most volatile in the first 30 minutes after the opening bell (9:30–10:00 a.m. ET) and during the final hour before close (3:00–4:00 p.m. ET). The opening absorbs overnight news and pending orders, while the closing hour reflects institutional rebalancing and end-of-day positioning, producing the day’s largest price swings.
Why does the stock market drop when good news comes out?
The stock market sometimes drops on good news because investors had already priced in even better news, or because strong economic data reduces the Federal Reserve’s incentive to cut interest rates. Good news for the economy can be bad news for stock valuations if it signals tighter monetary policy ahead. This is the “good news is bad news” dynamic.
How much does the Fed actually move the market on Fed days?
Federal Reserve meetings produce some of the largest single-day moves in the stock market, with the S&P 500 often swinging 1% to 3% within hours of the 2:00 p.m. ET statement release. The press conference at 2:30 p.m. frequently amplifies the move further, as the Fed Chair’s tone reshapes interest rate expectations across the entire yield curve.
Can a single earnings report move the entire stock market?
Yes, a single earnings report can move the entire stock market when it comes from a mega-cap company like Apple, Microsoft, or Nvidia. These companies carry such heavy weight in the S&P 500 and Nasdaq 100 that a 5% post-earnings move in one of them can shift the broader indices by 0.3% to 0.7%, especially during quiet trading sessions.
What is the most important economic report for the stock market?
The single most important recurring economic report for the U.S. stock market is the monthly Nonfarm Payrolls report, released the first Friday of each month at 8:30 a.m. ET. It shows job creation, the unemployment rate, and wage growth, and it directly shapes Federal Reserve policy expectations, which in turn drive valuations across every sector.
Why does the market move when nothing happened that day?
The stock market moves on days without major news because of positioning shifts, options expiration mechanics, sector rotation, algorithmic flows, and reactions to overnight global market action. Market makers hedging options exposure alone can cause meaningful intraday moves. “Nothing happened” rarely means nothing — it usually means nothing made the headlines.
How can I track what’s moving the stock market each day?
Track daily market drivers using a free economic calendar (Investing.com, FXStreet, or the New York Fed calendar) for upcoming data releases, follow the 10-year Treasury yield as a leading indicator, watch sector ETFs to spot rotation, and check FedWatch for rate expectations. Avoid relying on after-the-fact financial news headlines for explanations.
Does the stock market always go up over time?
The U.S. stock market has trended upward over the long term, with the S&P 500 averaging roughly 10% annualized returns since 1926, including dividends. However, individual years can produce significant losses, and recovery periods after major drawdowns have historically ranged from months to several years. Long-term gains are not guaranteed.
Conclusion: Read the market, not the headlines
What moves the stock market each day isn’t a single news story — it’s the interaction of expectations, positioning, and a small number of high-impact data releases. Most daily moves are smaller than the financial media makes them sound, and most explanations after the close are written backward to fit the day’s biggest headline.
The investors who consistently understand daily moves do four things differently. They watch the economic calendar instead of the news. They focus on surprises versus expectations, not raw numbers. They respect the rhythm of the trading day. And they ignore noise from second-tier releases that don’t actually move the index.
Your action step for this week: open a free economic calendar, identify the next FOMC meeting and the next CPI release, and watch how the S&P 500 reacts in the first 30 minutes. Compare the actual data to consensus expectations. Within a few cycles, the patterns become obvious — and the daily moves stop feeling random.
For more education on Fed policy, earnings analysis, and how to read market signals without the noise, explore TheFintechZoom’s investing and personal finance guides. We publish honest, independent analysis built on data — not headlines.