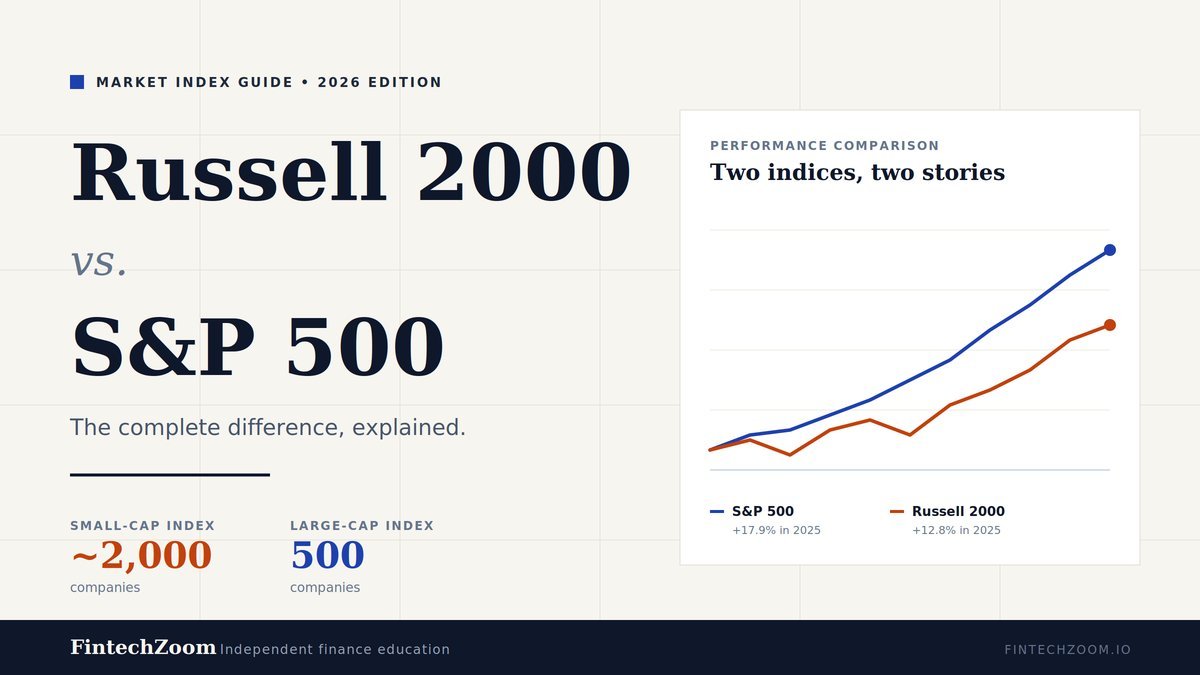
The Russell 2000 vs S&P 500 difference comes down to one thing: company size. The S&P 500 tracks 500 of the largest U.S. companies, dominated by mega-cap technology. The Russell 2000 tracks roughly 2,000 of the smallest publicly traded U.S. firms, heavily weighted toward regional banks, industrials, and biotech. They tell two very different stories about the American economy — and in 2026, those stories have rarely diverged this sharply.
If you’re choosing between SPY (S&P 500 ETF) and IWM (Russell 2000 ETF), or just trying to understand what financial news is actually telling you when these indices move in opposite directions, this guide breaks it down without the jargon. I’ll walk through the structural differences, real performance numbers from 2025–2026, the hidden concentration risk most investors miss, and a plain-language answer to which one belongs in your portfolio.
What is the actual difference between the Russell 2000 and the S&P 500?
The core difference is market capitalization. The S&P 500 holds 500 of the largest U.S. companies — typically firms valued above $22.7 billion — while the Russell 2000 holds approximately 2,000 small-cap companies, ranging from about $146 million to $5.7 billion in market value as of mid-2026. One represents the giants; the other represents the engine room of the U.S. economy.
Here’s where it gets interesting. These aren’t just “big vs. small” indices — they’re built differently from the ground up.
The S&P 500 is committee-selected. A team at S&P Dow Jones Indices reviews candidates against strict criteria: a market cap of at least $22.7 billion (updated July 2025), four consecutive quarters of positive earnings, sufficient public float, and U.S. domicile. Inclusion is partly judgment, not just a math equation. That’s why a profitable mega-cap can sit outside the index for years if the committee isn’t ready to add it.
The Russell 2000 is purely rules-based. FTSE Russell ranks every eligible U.S. public company by market cap and slots the bottom 2,000 of the top 3,000 into the small-cap index. No committee, no earnings test, no judgment calls. If you fit the size band on the ranking day, you’re in. Starting in 2026, this reconstitution shifts from once a year to twice a year, meaning the index refreshes faster.
There are three more differences that matter for your portfolio:
Sector mix. The S&P 500 leans heavily on Information Technology, which now accounts for roughly 34.6% of the index. The Russell 2000 has minimal tech exposure — its largest sector is Financials (regional banks, insurance), followed by Industrials and Health Care.
Revenue source. Russell 2000 companies typically earn most of their revenue inside the United States. S&P 500 companies are global — roughly 40% of their revenue comes from overseas. That changes how each index reacts to dollar strength, trade policy, and global growth.
Profitability. Every S&P 500 company is currently profitable (it’s an inclusion requirement). Roughly 30–40% of Russell 2000 companies have lost money over the trailing twelve months in recent years. That single fact explains a lot of the volatility gap.
How do the Russell 2000 and S&P 500 compare on returns, risk, and valuation?
Over the long run, both indices have produced similar returns — historically the Russell 2000 even slightly edges out the S&P 500. But the past decade flipped that script entirely. The S&P 500 returned about 15.6% annualized over the trailing ten years versus 11.1% for the Russell 2000, largely because of the Magnificent Seven tech rally that small caps didn’t participate in.
Here are the numbers I keep coming back to when explaining this to readers:
Recent performance (2025)
- S&P 500 total return: ~17.9%
- Russell 2000 total return: ~12.8%
- Nasdaq 100 (for context): ~21.2%
The story of 2025 was clear — mega-cap tech carried the market. But the late 2025 picture started to shift. After the Federal Reserve’s late-2025 rate cuts, small caps caught a bid. In April 2026, IWM (Russell 2000 ETF) returned roughly 12.1% in a single month, while SPY actually fell about 10.5%. That’s the kind of divergence that catches investors off guard.
Risk profile
Small caps are objectively riskier on every metric that matters:
| Risk Metric | S&P 500 | Russell 2000 |
|---|---|---|
| Max drawdown (last decade) | -33.8% | -41.8% |
| 5% Value-at-Risk (monthly) | -6.63% | -9.26% |
| Volatility | Lower | Higher |
| Recovery time from drawdowns | Faster | Slower |
| Correlation between them | 0.8 average (range: 0.6–0.96) | — |
The Russell 2000 doesn’t just fall harder — it stays down longer. Both indices bottomed during the March 2020 COVID selloff, but small caps took noticeably more time to claw back to break-even. If you’re an investor who panic-sells at the bottom, this matters more than the headline return numbers.
Valuation (as of early 2026)
This is where 2026 gets genuinely interesting. The two indices are trading at very different multiples:
- S&P 500 P/E ratio: ~25.2x earnings
- Russell 2000 P/E ratio: ~20.4x earnings (roughly a 19% discount)
For the first time in years, small caps are noticeably cheaper than large caps on a price-to-earnings basis. Whether that discount closes — and how — is one of the bigger debates in the market right now.
Which sectors dominate the Russell 2000 vs the S&P 500 in 2026?
The two indices have almost no meaningful sector overlap. The S&P 500 is now a concentrated technology bet, with Information Technology making up about 34.6% of the index and the “Magnificent Seven” — Apple, Microsoft, Nvidia, Amazon, Alphabet, Meta, and Tesla — accounting for roughly 35–40% of total market cap. The Russell 2000, by contrast, is led by Financials, Industrials, and Health Care, with almost no mega-cap tech exposure.
That’s not a small detail. It changes what each index actually represents.
S&P 500 sector reality (2026)
When the S&P 500 crossed 7,000 in January 2026 for the first time in history, the headlines called it a broad market milestone. The reality is narrower. Nvidia alone now commands roughly 12.7% of the index. The top 10 holdings combined represent more than 40% of total weight. The remaining 490 companies share less than 60% of the pie.
This concentration creates a strange situation. When people say “the S&P 500 is up,” they often mean “seven tech companies are up.” In 2025, the Magnificent Seven returned around 27.5% on average while the broader index returned about 16% — meaning the other 493 companies collectively did far less. Roughly 42% of the S&P 500’s 2025 total return came from those seven names alone.
For most of the index’s history, no single sector exceeded 30%. Today, technology sits around 34.6%. That’s a structural shift, not a passing rotation.
Russell 2000 sector reality (2026)
The Russell 2000 looks like the U.S. economy your grandparents would recognize:
- Financials: Largest sector, driven by regional and community banks
- Industrials: Manufacturing, construction, transportation
- Health Care: Heavy biotech and pharmaceutical representation
- Consumer Discretionary, Materials, Real Estate: Meaningful slices each
- Information Technology: Present but modest
This is why analysts often call the Russell 2000 a “barometer of the domestic economy.” If U.S. consumers are spending, U.S. banks are lending, and U.S. construction is humming, small caps tend to do well. When credit tightens or recession fears spike, they’re hit first and hardest.
The diversification angle most investors miss
I see this question constantly: “If I own SPY, do I need IWM too?” The data says yes, the overlap is genuinely small. Adding the Russell 2000 to an S&P 500 position isn’t just adding more U.S. stocks — it’s adding meaningful exposure to sectors and company types the S&P 500 barely touches. Regional banking, small biotech, domestic industrials, and microcap growth stories live almost entirely in the Russell 2000.
The catch: that diversification benefit comes with higher volatility, longer drawdowns, and historically (over the past decade) lower returns. There’s no free lunch.
Which index should you actually invest in?
There’s no universal answer. The S&P 500 makes sense for investors who want broad U.S. exposure with lower volatility and proven long-term compounding. The Russell 2000 makes sense for investors who want true small-cap exposure, willingness to ride deeper drawdowns, and belief that small caps will eventually mean-revert to their historical premium over large caps. Most serious portfolios hold both, weighted by risk tolerance.
Let me walk through how this decision actually plays out.
You probably want more S&P 500 exposure if:
- You’re within 5–10 years of retirement and can’t afford a 40%+ drawdown
- You want global revenue exposure through U.S.-listed companies
- You believe AI and large-cap tech will continue leading the market
- You prefer lower volatility and faster recovery from selloffs
- You’re investing in a taxable account and want fewer reconstitution turnover events
You probably want more Russell 2000 exposure if:
- You have a 15+ year time horizon and can stomach deeper drawdowns
- You believe small caps will mean-revert after a decade of underperformance
- You want exposure to the domestic U.S. economy, not global mega-caps
- You’re worried about S&P 500 concentration risk in the Magnificent Seven
- You see the current ~19% P/E discount as a buying signal
The common mistakes I see
Mistake 1: Treating the S&P 500 as “diversified.” Owning 500 stocks sounds diversified. Owning an index where 40% of your money sits in 10 names is not diversified in any meaningful sense. If you only hold SPY or VOO, you’re more concentrated in mega-cap tech than you probably realize.
Mistake 2: Chasing the Russell 2000 after a hot month. Small caps move in bursts. The same dynamic that lets IWM gain 12% in a month also lets it lose 10%+ quickly. Buying after a sharp rally — like the late-2025/early-2026 rotation — often catches investors right before the next pullback.
Mistake 3: Ignoring fees and tracking. For the Russell 2000, the two main ETFs are IWM (iShares, 0.19% expense ratio) and VTWO (Vanguard, 0.07%). Same index, very different cost over 20 years. For the S&P 500, IVV, VOO, and SPY all track the same index, but VOO and IVV are cheaper than SPY for long-term holders.
Mistake 4: Assuming “small cap” means “cheap.” A 20x P/E is cheaper than 25x, but it’s not historically cheap in absolute terms. Small caps were trading at 13–15x earnings during prior buying opportunities. Today’s discount is relative, not absolute.
Mistake 5: Picking one and ignoring the other. The most boring answer is usually right: a market-cap-weighted total U.S. market fund (like VTI) gives you both, in roughly the right proportions, with no decision required.
Frequently Asked Questions
Is the Russell 2000 riskier than the S&P 500?
Yes, meaningfully so. The Russell 2000 has experienced a maximum drawdown of about 41.8% over the past decade versus 33.8% for the S&P 500. Its 5% monthly Value-at-Risk is -9.26% compared to -6.63% for the S&P 500. Higher volatility, deeper losses, and longer recovery periods are the cost of small-cap exposure.
Does the Russell 2000 outperform the S&P 500 long-term?
Historically, yes — small caps slightly outperformed large caps since the Russell 2000 began in 1979. But the past decade flipped that pattern. The S&P 500 returned about 15.6% annualized over the trailing 10 years versus 11.1% for the Russell 2000, driven largely by mega-cap tech outperformance that small caps didn’t share in.
What’s the difference between IWM and SPY?
IWM is the iShares Russell 2000 ETF, tracking approximately 2,000 small-cap U.S. companies with an expense ratio of 0.19%. SPY is the SPDR S&P 500 ETF, tracking the 500 largest U.S. companies at 0.0945%. They represent entirely different market segments — small-cap domestic versus large-cap global mega-caps. Many investors hold both for diversification.
Why is the S&P 500 so concentrated in technology?
The S&P 500 is market-cap weighted, meaning the biggest companies get the most weight. As Apple, Microsoft, Nvidia, and other tech giants grew into multi-trillion-dollar firms, their share of the index grew automatically. As of early 2026, technology represents roughly 34.6% of the S&P 500 and the Magnificent Seven alone account for 35–40% of total market capitalization.
How often does the Russell 2000 get rebalanced?
The Russell 2000 was traditionally reconstituted once a year each June. Starting in 2026, FTSE Russell moved to a semi-annual reconstitution schedule — meaning the index now refreshes twice per year. This change reduces the trading friction concentrated in a single rebalance day and keeps the index more current with market cap changes.
Can a Russell 2000 company graduate to the S&P 500?
Not directly. A small-cap stock would first grow into the Russell 1000 (the large-cap segment of the Russell 3000). To enter the S&P 500 specifically, it would also need to meet S&P’s separate criteria — including the $22.7 billion market cap floor, four consecutive quarters of positive earnings, and committee approval. The two index families operate independently.
Which is better for beginners — Russell 2000 or S&P 500?
For most beginners, the S&P 500 is the more sensible starting point. It’s less volatile, recovers faster from selloffs, and contains the highest-quality U.S. companies by definition. The Russell 2000 is better added later, as a satellite holding alongside an S&P 500 core position, once an investor understands their tolerance for deeper drawdowns.
Are small caps undervalued in 2026?
By one measure, yes. The Russell 2000 trades at roughly 20.4x earnings versus 25.2x for the S&P 500 — about a 19% discount. However, small caps are still expensive by their own historical standards, and a meaningful portion of Russell 2000 constituents aren’t currently profitable. “Cheaper than large caps” doesn’t automatically mean “cheap in absolute terms.”
The bottom line
The Russell 2000 vs S&P 500 difference isn’t about which one is “better” — it’s about which slice of the U.S. economy you want to own. The S&P 500 gives you the largest, most profitable, globally focused American companies, with all the upside and concentration risk that brings in 2026. The Russell 2000 gives you the domestic small-cap engine of the economy, with higher volatility, deeper drawdowns, and a current valuation discount.
For most long-term investors, the honest answer is to own both, in proportions that match your risk tolerance and timeline. A simple approach: use a low-cost S&P 500 ETF (VOO or IVV) as your large-cap core, then add a Russell 2000 ETF (VTWO or IWM) at 10–20% of your U.S. equity allocation for genuine small-cap exposure.
If you want to skip the rebalancing decision entirely, a total U.S. stock market fund handles the weighting automatically.
Your next step: Pull up your current portfolio and check your actual exposure to the top 10 S&P 500 holdings. If those names make up more than 30% of your overall stock allocation, you’re more concentrated than you probably intended — and that’s the case for adding small-cap exposure, regardless of which way the next quarter goes.
Disclamer: TheFintechZoom is an independent finance education site. This guide is informational, not personalized investment advice. Index data referenced is from FTSE Russell, S&P Dow Jones Indices, and publicly available market data as of mid-2026. Past performance does not guarantee future results.