If you’ve been nodding along when financial news mentions a “bull market” or “bear market” without fully knowing what either term means, you’re in good company. These phrases are everywhere — and rarely explained well.
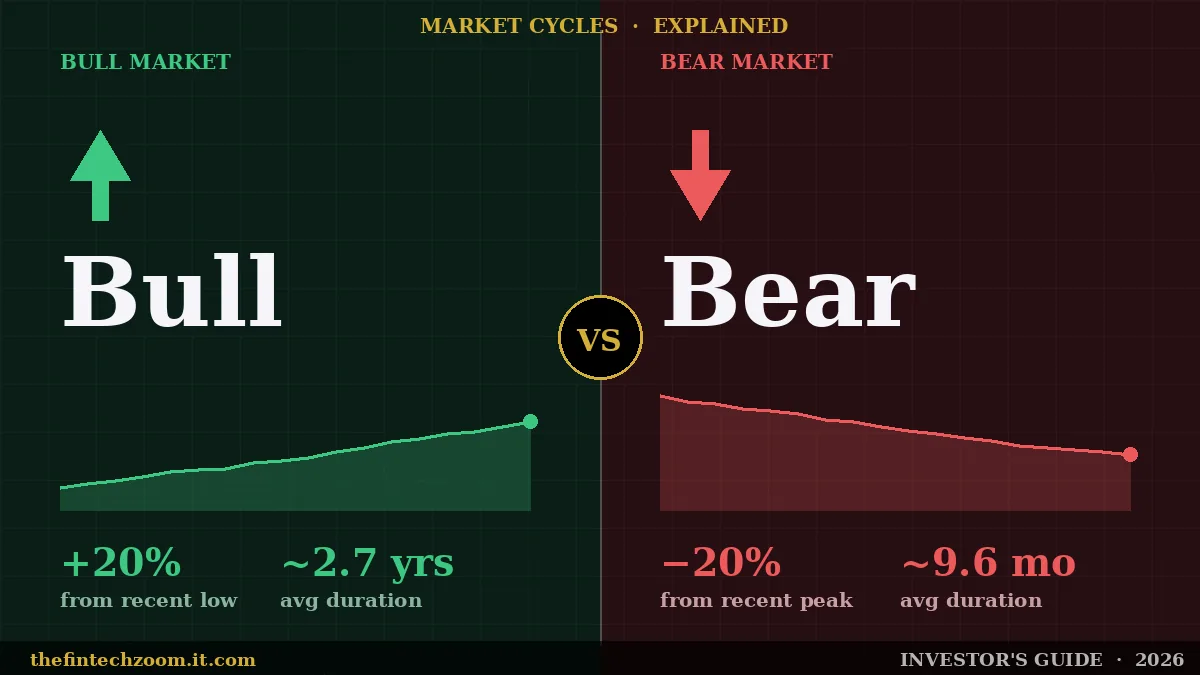
Here’s the direct version: a bull market means prices are rising at least 20% from a recent low, with widespread investor optimism. A bear market means prices have fallen 20% or more from a recent peak, driven by fear and economic slowdown. That 20% threshold is the industry standard for both.
This guide breaks down both cycles clearly — what causes them, how to recognize them, how long they last, and what smart investors actually do during each phase. No filler, no financial jargon walls.
What Is a Bull Market vs Bear Market? The Core Definitions
A bull market is a sustained period during which stock prices rise 20% or more from a recent low, fueled by economic growth, strong corporate earnings, and high investor confidence. A bear market is the reverse: a 20% or greater decline from a recent peak, typically accompanied by rising unemployment, slowing growth, and widespread fear among investors.
The 20% line is not arbitrary. Without a clear threshold, every two-week dip would get labeled a “bear market” and every brief bounce a “bull run.” The 20% rule gives both terms real analytical weight and makes market comparisons consistent across decades of data.
The Bull Market: What It Actually Feels Like
In a bull market, optimism feeds on itself. Companies report strong earnings. Unemployment falls. Consumers spend confidently. Investors expect prices to keep climbing — and that expectation itself drives more buying, which pushes prices higher.
The longest bull market in U.S. history ran from March 2009 to February 2020 — 131 months, nearly 11 years. During that stretch, the S&P 500 gained over 400%. The main fuel: near-zero interest rates from the Federal Reserve, massive corporate share buybacks, and a technology sector that grew from large to dominant.
Three factors that typically power a bull market:
- A growing economy (rising GDP and consumer spending)
- Low interest rates that make borrowing cheap for both companies and individuals
- Strong corporate profits that justify higher stock valuations
The Bear Market: What It Actually Looks Like
In a bear market, fear takes over. As prices drop, some investors panic and sell, which pushes prices further down, which triggers more fear. The cycle is self-reinforcing until conditions improve enough to break it.
Not all bear markets are equal. The 2020 COVID crash saw the S&P 500 fall 34% in just 33 trading days — the fastest bear market in modern history. The 2008 financial crisis was slower and deeper: the S&P 500 dropped roughly 48% from peak to trough over about 17 months. Same label, very different experiences.
Three common triggers for bear markets:
- Economic recessions or credible recession fears
- Rising interest rates that suppress borrowing, spending, and valuation multiples
- External shocks — pandemics, geopolitical crises, financial system failures
How Do You Tell Which Market You’re Actually In?
You’re in a bull market when a major index like the S&P 500 has risen 20% or more from a confirmed low, and the general trend is upward. You’re in a bear market when it has fallen 20% or more from a recent peak. The catch: no official body declares a bear or bull market in real time — analysts confirm them after the fact, once the data is unambiguous.
This delay trips up a lot of new investors. By the time a bear market is officially named in financial media, the move has already happened.
Four signals that a bear market may be developing:
- A major index falls 20% or more from its recent peak — the clearest, most widely accepted signal
- An inverted yield curve — when short-term Treasury bonds yield more than long-term ones, it has preceded most U.S. recessions in the last 60 years
- Rising unemployment claims — a steady week-over-week increase signals the real economy is weakening, not just the market
- Falling consumer confidence — tracked monthly by organizations like the University of Michigan; when consumers feel pessimistic, they spend less, which slows corporate revenue
None of these signals alone confirms a bear market. When two or three align, treat it as a serious warning worth acting on defensively.
Bull Market vs Bear Market: Key Differences at a Glance
Here’s a direct comparison of the defining characteristics of each cycle, based on data compiled by Ned Davis Research and Hartford Funds covering market history since 1928.
| Feature | Bull Market | Bear Market |
|---|---|---|
| Price movement | Rising 20%+ from a confirmed low | Falling 20%+ from a confirmed peak |
| Investor mood | Optimistic, confident | Fearful, risk-averse |
| Economic backdrop | Expanding (GDP growth, low unemployment) | Contracting or slowing |
| Interest rates | Typically low or falling | Often rising to fight inflation |
| Average duration | ~2.7 years (988 days) | ~9.6 months (289 days) |
| Average S&P 500 change | +112% | −35% |
| How often they occur | — | Every ~3.5 years since 1928 |
| Time in market | ~78% of all years | ~22% of all years |
| Best investor response | Stay invested, rebalance periodically | Avoid panic, maintain allocations, harvest tax losses |
The most important figure in that table: stocks have been rising roughly 78% of the time since 1928, according to Ned Davis Research. Bear markets are painful interruptions in a much longer upward story.
What Actually Causes Bull and Bear Markets?
Market cycles — alternating between expansion and contraction — emerge from two forces working together: economic fundamentals and human psychology. Neither alone explains the full picture.
The Economic Engine
Interest rates are the single most powerful lever. When the Federal Reserve cuts rates, borrowing becomes cheap. Companies expand. Consumers finance purchases. Investors move money from low-yielding bonds into stocks, pushing equity prices higher. When the Fed raises rates to fight inflation, the reverse happens across every part of that chain simultaneously.
The economic cycle maps loosely onto market cycles:
- Expansion → Bull market conditions
- Peak → Late bull / market transition
- Contraction (recession) → Bear market conditions
- Trough → Recovery / new bull market
Of the 27 bear markets since 1928, the majority coincided with an official recession, defined as two consecutive quarters of negative GDP growth. But bear markets can also occur without a recession, as in the 2022 case driven primarily by rising rates rather than economic collapse.
The Psychology Layer
Here’s what most standard finance articles skip: markets don’t move purely on facts. They move on what investors expect to happen next.
In a bull market, optimism compounds. Rising prices attract new buyers, new buyers push prices higher, and the cycle feeds itself until reality fails to match expectations. In a bear market, fear works identically in reverse. Falling prices trigger selling, selling drives further declines, and media coverage amplifies the panic.
John Maynard Keynes labeled this “animal spirits” — the irrational emotional forces that drive market behavior beyond what fundamentals alone can justify. Behavioral economists have since documented these patterns rigorously. The key practical implication: investor behavior during market cycles often matters more than the cycle itself.
Real Historical Examples That Define Both Cycles
Looking at actual market cycles is the fastest way to internalize what these terms mean in practice — beyond the textbook definitions.
The 2009–2020 Bull Market: The Longest on Record
After the 2008 financial crisis wiped out roughly half the market’s value, the S&P 500 bottomed in March 2009 around 666 points. What followed was an 11-year climb to over 3,386 by February 2020 — a gain of more than 400%.
This bull run had unusual fuel: interest rates near zero for a historically long stretch, massive corporate share buybacks, and a technology sector that remade entire industries. It ended abruptly — not from economic exhaustion, but from a global pandemic shutting down the world economy in a matter of weeks.
The 2020 COVID Bear Market: The Fastest in History
The S&P 500 fell 34% in just 33 trading days, from its February 19, 2020 peak to its March 23 trough. No decline in modern market history moved that fast. The recovery was equally dramatic: by August 2020, just five months later, the index had fully recovered and was hitting new highs.
Investors who sold during the panic of late March locked in a 30%+ loss and missed one of the sharpest recoveries on record. Investors who held — or bought into the dip — were fully rewarded within a single quarter.
The 2022 Bear Market: The Grinding Rate-Hike Decline
With inflation reaching 40-year highs, the Federal Reserve raised interest rates at the fastest pace since the 1980s. The S&P 500 fell about 25% from its January 2022 peak to its October 2022 trough — not a sudden crash, but a slow, grinding nine-month decline that punished growth stocks most severely. The tech-heavy Nasdaq fell over 33%. But the bear market ended in October 2022, and the subsequent bull run through 2023, 2024, and into 2025 again rewarded investors who stayed disciplined.
The Pattern Across All Four Major Modern Bear Markets
The dot-com crash (2000–2002, −49%). The 2008 financial crisis (~−48%). The 2020 COVID crash (−34%). The 2022 rate-hike bear (−25.4%). Every single one ended. Every market recovered. That doesn’t guarantee any individual stock will recover — but diversified index fund investors have always eventually recovered. This is the historical record.
How Should You Invest During Each Market Phase?
Smart investors don’t flip their entire strategy based on the current cycle label. They make calibrated, disciplined adjustments.
During a Bull Market
- Stay invested — sitting on the sidelines waiting for a pullback that may not arrive for years is the most common bull-market mistake
- Rebalance periodically — after a long bull run, your equity allocation may have grown well past your intended target; rebalancing locks in gains and restores your risk profile
- Guard against overconfidence — rising markets make average investors feel like geniuses; this is precisely when risk management discipline matters most
- Maintain a modest cash position — this lets you buy during dips without being forced to sell existing positions
During a Bear Market
- Do not panic-sell — selling during a decline locks in paper losses and removes you from the market when the recovery begins; research shows 78% of the market’s best single-day gains occur during bear markets or in the first two months of recovery
- Reassess your actual risk tolerance — if market swings are disturbing your sleep or judgment, your allocation was always more aggressive than you realized
- Consider tax-loss harvesting — selling losing positions to offset realized gains elsewhere reduces your current tax bill without changing your long-term exposure, if you reinvest in a similar (not identical) position
- Keep contributing via dollar-cost averaging — regular, fixed-amount contributions buy more shares at lower prices, reducing your average cost over time
- Look for quality at a discount — bear markets put strong, durable businesses on sale; investors who bought quality positions in March 2009 and March 2020 were substantially rewarded
One principle cuts across both phases: your time horizon is the determining variable. A 30% market drop is a planning opportunity for a 35-year-old with 30 years to retirement. It’s a serious financial event for someone who plans to retire in three years and needs cash. Same bear market, entirely different response required.
Myths About Bull and Bear Markets That Cost Investors Money
Myth 1: You Can Time the Market
The idea of consistently selling before a bear market starts and buying back at the trough is seductive — and the evidence against it is overwhelming. Missing just the 10 best trading days across any 20-year period typically cuts total returns in half. Those best days cluster around the worst days. Market timing fails most investors who attempt it consistently, including professionals with enormous resources.
Myth 2: Bear Markets Mean You Should Move Everything to Cash
Cash feels safe during a market decline. It’s also a reliable way to miss the recovery. Bear markets end without warning, often sharply. The S&P 500’s single largest daily gain during the COVID bear (+9.4% on March 24, 2020) came the day after one of its worst. Investors sitting in cash missed that entirely.
Myth 3: Bull Markets Mean Stocks Always Go Up
Even in the longest bull markets, corrections (declines of 10–20%) occur regularly — roughly every 1–2 years. The 2009–2020 bull market included multiple corrections exceeding 10%. Volatility is normal in a healthy bull market; it doesn’t end the cycle.
Myth 4: “This Time Is Different”
These four words have preceded enormous financial mistakes across every market generation. Every bear market feels uniquely catastrophic while it’s happening. Every extended bull market eventually convinces investors it will last forever. The historical record says both beliefs are wrong — consistently.
Myth 5: Bear Markets Are Universally Negative
Short sellers, put options buyers, and investors holding bonds, gold, or defensive assets like consumer staples and utilities often perform well during bear markets. The losses are concentrated in growth stocks and leveraged positions. A well-diversified portfolio absorbs bear markets very differently than an all-growth-stock portfolio.
Frequently Asked Questions About Bull and Bear Markets
What’s the simplest way to explain a bull vs bear market?
A bull market means stock prices have risen 20% or more from a recent low, with widespread investor optimism. A bear market means prices have fallen 20% or more from a recent peak, driven by fear and economic uncertainty. The 20% threshold is the industry standard for both definitions, used by financial professionals, analysts, and research firms worldwide.
How long does a bear market typically last?
Based on Ned Davis Research data covering market history since 1928, the average bear market lasts approximately 289 days — just under 10 months. Some are dramatically shorter (the 2020 COVID bear lasted 33 days). Some last much longer (the 2000–2002 dot-com crash ran for 685 days). Recovery to prior price highs typically takes longer than the decline itself — often an additional 1–3 years.
Can you make money during a bear market?
Yes. Investors can profit through short selling, buying put options, or rotating into asset classes that hold value or rise during equity downturns — such as government bonds, gold, or defensive sectors like healthcare and utilities. That said, most long-term investors focus on holding through the decline rather than actively profiting from it, since bear markets are historically temporary.
What’s the difference between a bear market and a market correction?
A correction is a pullback of 10–20% from a recent peak. It’s common, usually short-lived, and doesn’t necessarily reflect deep economic trouble. A bear market requires a 20%+ decline and typically signals more serious underlying economic weakness. Every bear market begins as a correction, but the majority of corrections reverse before reaching the 20% bear market threshold.
Should I stop investing during a bear market?
Most long-term investors should not stop. Halting contributions during a decline means missing the opportunity to buy shares at lower prices — precisely when long-term returns are being built. Dollar-cost averaging (investing a fixed amount on a regular schedule regardless of market conditions) smooths out volatility and is backed by decades of evidence as an effective strategy for non-professional investors.
What sectors hold up best during a bear market?
Defensive sectors — healthcare, utilities, consumer staples, and sometimes gold — tend to lose less value during bear markets than growth or cyclical sectors. The logic is simple: people still buy medicine, pay electricity bills, and buy groceries regardless of market conditions. These sectors don’t soar in bull markets, but they absorb significantly less damage during downturns.
Is a recession the same as a bear market?
No. A recession is an economic event measured in GDP data: two consecutive quarters of negative economic growth. A bear market is a market event: a 20%+ decline in stock prices. They frequently overlap, but not always. The 2022 bear market coincided with GDP contraction in two quarters but was never officially declared a recession by the National Bureau of Economic Research. Conversely, the 2001 recession caused a bear market, but not the most severe one of that period.
Final Takeaways
Understanding the difference between a bull market vs bear market isn’t just vocabulary — it’s the framework through which every significant investment decision gets made. Bull markets reward patience and sustained exposure to the market. Bear markets test emotional discipline and reveal whether your allocation actually matches your real tolerance for loss.
Three things worth carrying forward:
- The 20% rule — that’s the line between a rough patch and a defined market cycle
- Duration context — bear markets average under 10 months; bull markets average 2.7 years; stocks rise roughly 78% of all years
- Behavior is the variable — the market’s performance affects everyone equally; your reaction to it determines your actual financial outcome
Your action step: Pull up your current portfolio and honestly compare it against your actual time horizon. If a 30–40% decline would force you to sell to cover expenses or would cause you to panic-sell emotionally, your allocation is more aggressive than it should be — regardless of what the market is doing right now.